| Issue |
A&A
Volume 629, September 2019
|
|
|---|---|---|
| Article Number | A117 | |
| Number of page(s) | 9 | |
| Section | Galactic structure, stellar clusters and populations | |
| DOI | https://doi.org/10.1051/0004-6361/201936283 | |
| Published online | 13 September 2019 | |
Stellar population astrophysics (SPA) with the TNG
GIANO-B spectroscopy of red supergiants in Alicante 7 and Alicante 10⋆
1
INAF – Osservatorio di Astrofisica e Scienza dello Spazio di Bologna, Via Gobetti 93/3, 40129 Bologna, Italy
e-mail: This email address is being protected from spambots. You need JavaScript enabled to view it.
2
INAF – Osservatorio Astrofisico di Arcetri, Largo E. Fermi 5, 50125 Firenze, Italy
3
Dipartimento di Fisica e Astronomia, Universitá degli Studi di Bologna, Via Gobetti 93/2, 40129 Bologna, Italy
4
INAF – Osservatorio Astronomico di Trieste, Via G.B. Tiepolo 11, 34143 Trieste, Italy
5
Dipartimento di Fisica e Astronomia, Universitá degli Studi di Roma Tor Vergata, Via della Ricerca Scientifica 1, 00133 Roma, Italy
6
INAF – Osservatorio Astronomico di Roma, Via Frascati 33, 00040 Monte Porzio Catone, Italy
Received:
10
July
2019
Accepted:
12
August
2019
Abstract
Aims. The Scutum complex in the inner disk of the Galaxy hosts a number of young clusters and associations of red supergiant stars that are heavily obscured by dust extinction. These stars are important tracers of the recent star formation and chemical enrichment history in the inner Galaxy.
Methods. Within the SPA Large Programme at the TNG, we secured GIANO-B high-resolution (R ≃ 50 000) YJHK spectra of 11 red supergiants toward the Alicante 7 and Alicante 10 associations near the RSGC3 cluster. Taking advantage of the full YJHK spectral coverage of GIANO in a single exposure, we were able to measure several hundreds of atomic and molecular lines that are suitable for chemical abundance determinations. We also measured a prominent diffuse interstellar band at λ1317.8 nm (vacuum). This provides an independent reddening estimate.
Results. The radial velocities, Gaia proper motions, and extinction of seven red supergiants in Alicante 7 and three in Alicante 10 are consistent with them being members of the associations. One star toward Alicante 10 has kinematics and low extinction that are inconsistent with a membership. By means of spectral synthesis and line equivalent width measurements, we obtained chemical abundances for iron-peak, CNO, alpha, other light, and a few neutron-capture elements. We found average slightly subsolar iron abundances and solar-scaled [X/Fe] abundance patterns for most of the elements, consistent with a thin-disk chemistry. We found depletion of [C/Fe], enhancement of [N/Fe], and relatively low 12C/13C < 15, which is consistent with CN cycled material and possibly some additional mixing in their atmospheres.
Key words: supergiants / stars: abundances / infrared: stars
Based on observations made with the Italian Telescopio Nazionale Galileo (TNG) operated on the island of La Palma by the Fundación Galileo Galilei of the INAF (Istituto Nazionale di Astrofisica) at the Spanish Observatorio del Roque de los Muchachos of the Instituto de Astrofisica de Canarias. This study is part of the Large Program titled SPA (Stellar population astrophysics: the detailed, age-resolved chemistry of the Milky Way disk; PI: L. Origlia), granted observing time with HARPS-N and GIANO-B echelle spectrographs at the TNG.
© ESO 2019
1. Introduction
Stellar population astrophysics experiences a golden era because of the Gaia mission and ongoing and near-future massive photometric, astrometric, and spectroscopic surveys that set the observational framework for an exhaustive description of the structure of the Milky Way (MW) and its satellites. Optical and near-infrared (NIR) high-resolution (HR) spectroscopy is crucial to provide the complementary detailed chemical tagging of selected stellar populations, in order to constrain timescales and overall formation and chemical enrichment scenarios. Only echelle spectra with simultaneous HR and wide spectral coverage might be able to allow measurements of the full set of iron-peak, CNO, alpha, neutron-capture, Li, Na, Al, and other light element abundances with the necessary high accuracy. These different elements are synthesized in stars and supernovae with different mass progenitors and are therefore released into the interstellar medium with different time delays with respect to the onset of the star formation event.
SPA Large Programme. The unique combination of the High Accuracy Radial velocity Planet Searcher for the Northern emisphere (HARPS-N) and GIANO-B echelle spectrographs at the Telescopio Nazionale Galileo (TNG), which together cover almost the full optical and NIR range out to the K band, is ideal to sample the luminous stellar populations of the MW thin disk over almost its entire extension, as seen from the Northern Hemisphere at a spectral resolution R ≥ 50 000. Thus, taking advantage of this HR capability, we proposed a Large Program called the SPA (Stellar population astrophysics: detailed age-resolved chemistry of the Milky Way disk; Program ID A37TAC_13, PI: L. Origlia). Observing time has been granted starting from June 2018. The SPA Large Programme aims at obtaining high-quality spectra of more than 500 stars in the MW thin disk and associated star clusters at different Galactocentric distances, including the poorly explored inner disk. We will observe luminous giant and supergiant stars in young star clusters and associations, luminous Cepheid and Mira variables across the entire thin disk, and main-sequence (MS) and other evolved stars of open clusters in the solar neighborhood.
The proposed observations will allow us to provide a detailed mapping of possible gradients, cosmic spreads, and other inhomogeneities of individual abundances and abundance ratios. We will also be able to answer a number of open questions regarding disk formation, evolution, and chemical enrichment, and we will perform critical tests of stellar evolution and nucleosynthesis. This will maximize the scientific return and the overall legacy value for astrophysics.
Based on this detailed chemical tagging and complementary kinematic and evolutionary information from the Gaia mission and other surveys, we expect in particular to set the framework for a comprehensive chemodynamical modeling of the disk formation and evolution. We hope to be able to distinguish radial migration from in situ formation scenarios (e.g., da Silva et al. 2016, and references therein) and the overall chemical enrichment history. In addition, given the expected high quality of the acquired spectra and the target properties, we will be able to perform the following stellar evolution tests and calibrations: (i) a first systematic investigation of the dependence of period-luminosity relations of variable stars on their detailed chemical content, (ii) a probe of the poorly explored physics and nucleosynthesis of red supergiants (RSGs), and (iii) a probe of crucial stellar evolution parameters, such as convection, diffusion, mixing, rotation, and magnetic fields in MS and evolved stars for different stellar ages and evolutionary stages.
2. High-resolution spectroscopy in the Scutum complex
In the central region of the MW close to the base of the Scutum-Crux arm and the tip of the long bar, at a distance of ≈3.5 kpc from the Galactic center, lies a giant region of star formation that is known as the Scutum complex. This region is characterized by three young and massive clusters: RSGC1 (Figer et al. 2006), RSGC2 (Davies et al. 2007), and RSGC3 (Clark et al. 2009; Alexander et al. 2009). They host a conspicuous population of RSG stars with stellar masses of ∼14–20 M⊙ and ages between 12 and 20 Myr. A total mass of 2−4 × 10⁴ M⊙ has been estimated for these clusters. Some extended associations of RSGs have also been identified around them: Alicante 8, in the proximity of RSGC1 and RSGC2 (Negueruela et al. 2010), and Alicante 7 (Negueruela et al. 2011) and Alicante 10 (Gonzalez-Fernandez & Negueruela 2012), which are associated with RSGC3.
The spectroscopic characterization of the chemical and kinematic properties of the stellar poplulations in the Scutum complex started only recently and used IR spectroscopy because of the huge (AV > 10) and patchy extinction that affects the Galactic plane in this direction at optical wavelengths.
First radial velocity (RV) measurements suggested that these young clusters and associations might share a common kinematics. For example, Davies et al. (2007, 2008) derived average local standard of rest (LSR) RVs of +109 and +123 km s−1 for RSGC2 and RSGC1, respectively, from K-band spectra with medium-high resolution of the CO bandheads. Negueruela et al. (2011) obtained average LSR RVs of +102 and +95 km s−1 for RSGC2 and RSGC3, respectively, from tmeasurement of the Ca II triplet lines.
Some chemical abundances of Fe, C, O, and other alpha elements were derived for stars in RSGC1 and RSGC2 (Davies et al. 2009a) using NIRSPEC-Keck spectra at a resolution R ≈ 17 000. They suggest slightly subsolar abundances.
RSGs are very luminous NIR sources even in highly reddened environments, such as the inner Galaxy, and they can be spectroscopically studied at HR even with 4 m class telescopes when these are equipped with efficient echelle spectrographs. A few years ago, during the commissioning and science verification of GIANO (see, e.g., Oliva et al. 2012a,b, 2013; Origlia et al. 2014), we therefore acquired HR (R ≈ 50 000) YJHK spectra of a few RSGs in the RSGC2 and RSGC3 clusters.
In particular, we observed three RSGs in RSGC2 in July 2012 and five RSGs RSGC3 in October 2013. Detailed RVs and chemical abundances of iron-peak, CNO, alpha, and a few other metals have been published in Origlia et al. (2013, 2016). They confirmed slightly subsolar iron and iron-peak elements, some depletion of carbon and enhancement of nitrogen, and approximately solar-scale [X/Fe] abundance ratios for the other metals.
Prompted by the results of these pilot projects, we decided to perform a more systematic investigation of the RSGs in the Scutum complex. As part of the SPA Large Program at the TNG, we are observing a representative sample of luminous RSG stars, candidate members of the young clusters and associations in the Scutum complex, using the refurbished GIANO-B spectrograph. This first paper presents the derived RVs and chemical abundances for RSG candidate members of the Alicante 7 and Alicante 10 associations near the RSGC3 star cluster.
3. Observations and data reduction
GIANO (Origlia et al. 2014) is the HR (R ≃ 50 000) YJHK (950–2450 nm) spectrometer of the TNG telescope. GIANO was designed to receive light directly from a dedicated focus of the TNG. The instrument was provisionally commissioned in 2012 and was used in the GIANO-A configuration. In this position, the spectrometer was positioned on the rotating building and fed through a pair of fibers that were connected to another focal station (Tozzi et al. 2014). The spectrometer was eventually moved to the originally foreseen configuration in 2016. This configuration is called GIANO-B (Tozzi et al. 2016). It can here also be used in the GIARPS mode for simultaneous observations with HARPS-N.
GIANO-B provides a fully automated online data reduction pipeline based on the GOFIO reduction software (Rainer et al. 2018) that processes all the observed data, from the calibrations (darks, flats, and U-Ne lamps taken in daytime) to the scientific frames. The main feature of the GOFIO data reduction is the optimal spectral extraction and wavelength calibration based on a physical model of the spectrometer that accurately matches instrumental effects such as variable slit tilt and order curvature over the echellogram (Oliva et al. 2018). The data reduction package also includes bad pixel and cosmic removal, sky and dark subtraction, and flat-field and blaze correction. It outputs the scientific data with different formats, including merged and non-merged echelle orders.
The GIANO-B guiding system uses the 850–950 nm light of the target itself as reference. When reddening is huge, as in the Scutum complex, the limiting factor therefore becomes the z-band magnitude of the target. For observations with GIANO-B we therefore selected those RSGs from the compilations of Negueruela et al. (2011) and Gonzalez-Fernandez & Negueruela (2012) with typically J < 10 and AV < 16, that is bright enough for both the spectrograph and the guiding camera.
Seven RSGs toward Alicante 7 and four RSGs toward Alicante 10 (see Table 1) have been observed with GIANO-B on June-July 2018. For the best subtraction of the detector artifacts and background, the spectra were collected by nodding the star along the slit, that is, with the target alternatively positioned at 1/4 (position A) and 3/4 (position B) of the slit length. Integration time was 5 min per A,B position. The nodding sequences were repeated to achieve a total integration time of 40 min per target. The spectra were reduced using the offline version of GOFIO1.
RSG stars in the Alicante 7 and Alicante 10 associations of RSGC3 observed with GIANO-B.
The telluric absorption features were corrected using the spectra of a telluric standard (O-type star) taken at different airmasses during the same nights. The normalized spectra of the telluric standard taken at low and high airmass values were combined with different weights to match the depth of the telluric lines in the stellar spectra.
4. Spectral analysis
Accurate (better than 1 km s−1) RVs and chemical abundances for the observed RSGs have been obtained by comparing the 1D GIANO-B spectra with suitable synthetic templates. This was previously done in Origlia et al. (2013, 2016) for RSGs in RSGC2 and RSGC3.
In order to compute the required grid of synthetic spectra to model the observed RSGs, we used an updated version (Origlia et al. 2002) of the code that was first described in Origlia et al. (1993). The code uses the LTE approximation and the MARCS model atmospheres (Gustafsson et al. 2008). Thousands of NIR atomic transitions from the Kurucz database2, from Biemont & Grevesse (1973) and Melendez & Barbuy (1999), and molecular data from our (Origlia et al. 1993, and subsequent updates) compilation and from the compilation of Plez (priv. comm.) are included. From this database, a comprehensive list of suitable lines for each chemical element that can be measured in the RSG spectra, free from significant blending and without strong wings, was extracted (see also Origlia et al. 2013) and used to compute equivalent widths. We used the Grevesse & Sauval (1998) abundances for the solar reference.
Hyperfine structure splitting was accounted for in the Ni, Sc, and Cu line profile computations. Including them does not significantly affect the abundance estimates, however.
4.1. Stellar parameters
In RSG stars, the strength of the OH and CN molecular lines is especially sensitive to temperature variations. Moreover, CN lines are also sensitive to gravity, and OH lines are sensitive to microturbulence. While the shape and broadening of the 12CO bandheads mostly depend on microturbulence, their strengths is a quite sensitive thermometer in the 3800–4500 K range, where temperature sets the fraction of molecular versus atomic carbon. At temperatures below 3800 K most of the carbon is in molecular form, which drastically reduces the dependence of the CO band strengths on the temperature itself. At temperatures ≥4500 K, CO molecules barely survive, most of the carbon is in atomic form, and the CO spectral features become very weak. A simultaneous reasonable fit of all the molecular lines and bandheads can be obtained only in a narrow range of temperature, gravity, and microturbulence, regardless of the adopted CNO abundances.
Moreover, although significantly different temperatures can be inferred using different scales (Levesque et al. 2005; Davies et al. 2013), synthetic spectra with temperatures that are significantly different (especially significantly warmer) than those providing the best-fit solutions can barely fit the observed spectra and require very peculiar (unlikely) CNO abundance patterns (see also Origlia et al. 2013, 2016).
As has been discussed in Origlia et al. (2013, 2016), at the GIANO spectral resolution of 50 000, we find that in RSGs variations of ±100 K in Teff, ±0.5 dex in log g, and ±0.5 km s−1 in microturbulence have effects on the spectral lines that can also be appreciated by some visual inspection. Variations in temperature, gravity, and microturbulence smaller than the above values are difficult to distinguish because the sensitivity of the lines is limited and the stellar parameters are degenerate. Moreover, such a finer tuning would have negligible effect on the inferred abundances (less than a few hundredths of a dex, i.e., smaller than the measurement errors). The effect of using different assumptions for the stellar parameters on the derived abundances is discussed in Sect. 4.2.
4.2. Chemical abundances
Chemical abundances were derived by minimizing the scatter between observed and synthetic spectra with suitable stellar parameters, by using spectral synthesis and, as figures of merit, line equivalent widths and statistical tests on both the difference between the model and the observed spectrum and on the χ2. As discussed in Origlia et al. (2013) and references therein, the simple difference is more powerful for quantifying systematic discrepancies than the classical χ2 test, which is instead equally sensitive to random and systematic deviations.
The typical random error of the measured line equivalent widths is < 10 mÅ. It mostly arises from a ±1–2% uncertainty in the placement of the pseudo-continuum, as estimated by overlapping the synthetic and observed spectra. This error corresponds to abundance variations of < 0.1 dex, that is, smaller than the typical 1σ scatter (< 0.15 dex) in the derived abundances from different lines. The errors quoted in Table 2 for the final abundances were obtained by dividing the 1σ scatter by the square root of the number of lines we used, typically from a few to a few tens per species. When only one line was available, we assumed an error of 0.10 dex.
Chemical abundances ([X/H]) of the RSG stars in the Alicante 7 and Alicante 10 associations observed with GIANO-B.
As detailed in Origlia et al. (2013), a somewhat conservative estimate of the overall systematic uncertainty in the abundance (X) determination, caused by variations of the atmospheric parameters, can be computed with the following formula: (ΔX)2 = (∂X/∂T)2(ΔT)2 + (∂X/∂log g)2(Δlog g)2 + (∂X/∂ξ)2 (Δξ)2. We computed test models with variations of ±100 K in temperature, ±0.5 dex in log g, and ±0.5 km s−1 in microturbulence velocity with respect to the best-fit parameters. We found that these systematic uncertainties in stellar parameters can affect the overall abundances at a level of 0.15–0.20 dex.
4.3. Diffuse interstellar bands: extinction and contamination
The observed stars are affected by a large and differential foreground interstellar absorption. Therefore, the diffuse interstellar band (DIB) absorption features (Geballe et al. 2011; Cox et al. 2014; Hamano et al. 2016) are expected to be visible in our spectra. These broad features may be conveniently used as an independent estimate of the foreground extinction within the limits related to the quite large scatter of the feature strength for stars with similar extinction.
The most prominent DIB feature among those reported in the above references falls at λ1317.8 nm. At this wavelength the RSG spectra are remarkably free of photospheric lines. This DIB feature can therefore easily be recognized and accurately measured in our spectra (see Fig. 1). The measured equivalent widths are reported in Table 1, together with the corresponding estimate of visual extinction (AV), based on the calibration with E(B − V) reported in Hamano et al. (2015, 2016). We find AV values in the 10–16 mag range, which is fully consistent with the corresponding E(J − K) values quoted by Negueruela et al. (2011) and Gonzalez-Fernandez & Negueruela (2012).
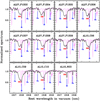 |
Fig. 1. Portion of the normalized telluric corrected spectra, showing the prominent DIB feature at 1317.8 nm. The dashed purple line is the telluric correction applied to the data. |
The other DIB features that can be directly measured in our spectra are λ1078.3, λ1262.6 and λ1280.2. They are much weaker, and their relative strengths are compatible with those reported in Hamano et al. (2016).
The other DIB features are much more difficult to recognize in our spectra because they fall at wavelengths where the spectra are crowded with photospheric lines of atomic and molecular species. To measure these lines would require a simultaneous modeling and fitting of the stellar and DIB spectra. This task is well beyond the aims of this paper. Nonetheless, the photospheric lines close to the DIB features should be used carefully. In particular, the region around the strong DIB feature at λ1527.3 nm should be avoided, whose equivalent width is expected to be similar to that of the feature at λ1317.8 (Cox et al. 2014).
5. Results
The best-fit values of the stellar parameters and RVs for the observed RSGs in Alicante 7 and Alicante 10 are reported in Table 1. We find temperatures in the 3500–3700 K range and microturbulence of 3–4 km s−1.
For all the observed stars we adopted a surface gravity of log g = 0.0. As for RSGs in RSGC2 and RSGC3 (Origlia et al. 2013, 2016), the line profiles of the observed stars in Alicante 7 and Alicante 10 are also definitely broader than the instrumental line profile (as determined from telluric lines and from the GIANO-B spectra of standard stars). This additional broadening is likely due to macroturbulence and is normally modeled with a Gaussian profile, as for the instrumental broadening. All the analyzed RSGs show macroturbulence velocity of 9–10 km s−1, which is well within the range of values measured in the RSGs of the Galactic center (see, e.g. Ramírez et al. 2000; Cunha et al. 2007; Davies et al. 2009b). We did not find other appreciable line broadening by stellar rotation.
The derived values of AV from the DIB feature at 1317.8 nm are consistent with the high extinction toward the Scutum complex for all but star AL10-N03 (see Table 1), which has a much weaker DIB feature and likely much lower extinction. Notably, this star also has a significantly lower RV than the other stars in Alicante 10.
The RVs of all the other stars measured in Alicante 7 and Alicante 10 are consistent with them being members of the Scutum complex, although they show lower values on average than the average value of RVhel = 90 km s−1 with a dispersion of 2.3 km s−1 that is measured in the parent cluster RSGC3 (Origlia et al. 2016). Only the heliocentric RV of star AL07-F1S04 exceeds 100 km s−1.
Proper motions for all the observed RSGs in Alicante 7 and Alicante 10 were measured from data of Gaia DR2 (Gaia Collaboration 2018; Francois et al. 2013) and are plotted in Fig. 2. The RVs and PMs of the RSGs in Alicante 7 are consistent with them being members of the association within the errors. The only possible exception is F1S09, whose proper motions are barely consistent with a membership at ≈3−4σ level, while its RV is well consistent. In Alicante 10 the three stars whose RVs are consistent with membership also have consistent proper motions, while the RV of N03 clearly is too low, the proper motions are too different, and the extinction is too low for it to likely be member of the association. In the following we only consider as member RSGs of the Alicante 10 association stars C06, C09, and C10.
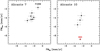 |
Fig. 2. Gaia DR2 proper motions for the observed stars in Alicante 7 (left panel) and Alicante 10 (right panel). The red dot indicates star N03, whose kinematics is inconsistent with being a member of the Alicante 10 association. |
For all the observed stars, Table 2 lists the derived chemical abundances and their associated errors of Fe and other iron-peak elements (V, Cr, Co, Ni, and Cu), CNO, and the other alpha elements (Mg, Si, Ca, and Ti), other light (F, Na, Al, P, S, K, and Sc), and a few neutron-capture (Y, Zr) elements. The atomic lines of V and Cu are heavily blended, therefore their derived abundances should be taken with caution. The few measurable Mn and SrII lines in the GIANO-B spectra are too strong or saturated to derive reliable abundances. While for most of the metals abundances were derived from the measurements of atomic lines, for the CNO elements they were obtained from the many molecular lines of CO, OH, and CN in the NIR spectra. 12C and 13C carbon abundances were determined both from a few individual roto-vibrational lines as well as from bandheads, because of the high level of crowding and blending of the CO lines in these stars. We found fully consistent results with the two methods. The fluorine abundance was determined from the HF(1–0) R9 line using the revised log gf and excitation potential values of Jönsson et al. (2014). A few other HF lines are present in the K-band spectrum of RSGs, but they were to too strongly blended or too faint to provide reliable abundance estimates.
Figure 3 shows the chemical abundances of the individual RSGs that are likely members of the Alicante 7 (seven stars) and Alicante 10 (three stars) associations. Figures 4 and 5 show the mean [X/H] abundances and [X/Fe] abundance ratios for all the sampled chemical elements, as computed by averaging the corresponding values for the seven RSGs in Alicante 7 and the three RSGs in Alicante 10 that are likely members of these associations, according to the measured RVs and high extinction.
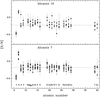 |
Fig. 3. Derived [X/H] chemical abundances and corresponding errors for the observed RSGs candidate members of the Alicante 7 (seven stars) and Alicante 10 (three stars) associations. Dotted lines mark the average [Fe/H] values in each association. |
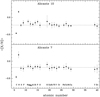 |
Fig. 4. Derived average [X/H] chemical abundances and corresponding errors for the observed RSGs, candidate members of the Alicante 7 and Alicante 10 associations. Dotted lines mark the average [Fe/H] values in each association. |
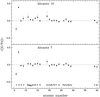 |
Fig. 5. Derived average [X/H] chemical abundances and corresponding errors for the observed RSGs, candidate members of the Alicante 7 and Alicante 10 associations. |
Average values of [Fe/H] = −0.18 and −0.215 dex and corresponding 1σ scatter of 0.06 and 0.05 dex for the RSGs that are likely members of Alicante 7 and Alicante 10, respectively, were measured. All the other chemical elements show about solar-scaled [X/Fe] abundance ratios within ±0.1 dex, with the only exception of C and N, which show a depletion of a few tenths of a dex for carbon and enhancement for nitrogen. The 12C/13C isotopic ratios between 9 and 13 were also measured.
6. Discussion and conclusions
For the seven RSGs in Alicante 7 and for three of the four RSGs of Alicante 10, the measured LSR RVs in the 79−123 km s−1 range suggest a Galactocentric radius of ≈4 ± 0.5 kpc and kinematic near (see, e.g., Roman-Duval et al. 2009) distances in the 5–7 kpc range, suggesting that they are likely located beyond the molecular ring and likely members of the Scutum complex. This is also consistent with the corresponding high extinction measured in their direction (see Table 1). For N03 toward Alicante 10 with an RVLSR of 33 km s−1, Galactocentric radius of ≈6 kpc and a near distance of ≈2.3 kpc can be derived. This suggests that N03 might be located in front of the molecular ring, which also agrees with its significantly lower extinction when compared to the values inferred in the Scutum complex.
All the metals measured in the RSGs of Alicante 7 and Alicante 10 show slightly subsolar abundances and about solar-scale abundance ratios. The only remarkable exceptions are the depletion of C, the enhancement of N, and the relatively low (in the 9–13 range) 12C/13C isotopic ratio, which are consistent with CN burning and other possible additional mixing processes that occur in the post-MS stages of stellar evolution. It is worth mentioning that the inferred [C/N] abundance ratios in the −0.77 ≤ [C/N] ≤ −0.49 range are also consistent with the surface values predicted by stellar evolution calculations for RSGs at the end of their lives (e.g., Davies & Dessart 2019). The rather homogeneous chemistry of Alicante 7 and Alicante 10 is also fully consistent with the abundances measured in a few RSGs of the parent RSGC3 cluster (Origlia et al. 2016). A more comprehensive chemical and kinematic study of the latter and the overall link with its associations will be presented in a forthcoming paper.
As discussed in Origlia et al. (2016), the slightly subsolar metallicity measured in regions of recent star formation in the Scutum complex is intriguing because metal abundances well in excess of solar have been measured in the thin disk at larger Galactocentric distances (see, e.g., Genovali et al. 2013, and references therein) and were also predicted by the inside-out formation scenario for the Galactic disk (Cescutti et al. 2007). Interestingly enough, the likely foreground RSG AL10-N03 also has slightly subsolar metallicity as well as pre-MS clusters at Galactocentric distances from 6.7 to 8.7 kpc that were studied by Spina et al. (2017). The innermost of these clusters are 0.10–0.15 dex less metallic than the majority of the older clusters that are located at similar Galactocentric radii.
This may suggest that recent star formation in the inner disk may have occurred from a gas that was not as enriched as expected. One possible explanation is dilution by metal-poor halo gas driven there by dynamical interactions of the disk with other galactic substructures such as bars, rings, and spiral arms.
A precise description of how this dynamical process could work is beyond the scope of this paper, but our observations have indeed pointed out another complexity in the evolution and chemical enrichment of the inner Galaxy that is to be addressed by future studies. At the completion of the SPA Large Programme, when a more comprehensive chemical and kinematic mapping of the Scutum complex and possibly of other regions of recent star formation will become available, this hypothesis can be verified on more comprehensive grounds.
Available at https://atreides.tng.iac.es/monica.rainer/gofio
Acknowledgments
We thank C. Evans, the referee of our paper, for his useful comments and suggestions.
References
- Alexander, M. J., Kobulnicky, H. A., Clemens, D. P., et al. 2009, AJ, 137, 4824 [NASA ADS] [CrossRef] [Google Scholar]
- Biemont, E., & Grevesse, N. 1973, At. Data Nucl. Data Tables, 12, 221 [NASA ADS] [CrossRef] [Google Scholar]
- Cescutti, G., Matteucci, F., François, P., & Chiappini, C. 2007, A&A, 462, 943 [NASA ADS] [CrossRef] [EDP Sciences] [Google Scholar]
- Clark, J. S., Davies, B., Najarro, F., et al. 2009, A&A, 504, 429 [NASA ADS] [CrossRef] [EDP Sciences] [Google Scholar]
- Cox, N. L. J., Cami, J., Kaper, L., et al. 2014, A&A, 569, A117 [NASA ADS] [CrossRef] [EDP Sciences] [Google Scholar]
- Cunha, K., Sellgren, K., Smith, V. V., et al. 2007, ApJ, 669, 1011 [Google Scholar]
- da Silva, R., Lemasle, B., Bono, G., et al. 2016, A&A, 586, A125 [NASA ADS] [CrossRef] [EDP Sciences] [Google Scholar]
- Davies, B., & Dessart, L. 2019, MNRAS, 483, 887 [NASA ADS] [CrossRef] [Google Scholar]
- Davies, B., Figer, D. F., Kudritzki, R.-P., et al. 2007, ApJ, 671, 781 [NASA ADS] [CrossRef] [Google Scholar]
- Davies, B., Figer, D. F., Law, C. J., et al. 2008, ApJ, 676, 1016 [NASA ADS] [CrossRef] [Google Scholar]
- Davies, B., Origlia, L., Kudritzki, R.-P., et al. 2009a, ApJ, 696, 2014 [NASA ADS] [CrossRef] [Google Scholar]
- Davies, B., Origlia, L., Kudritzki, R., et al. 2009b, ApJ, 694, 46 [NASA ADS] [CrossRef] [Google Scholar]
- Davies, B., Kudritzki, R., Plez, B., et al. 2013, ApJ, 767, 3 [NASA ADS] [CrossRef] [Google Scholar]
- Figer, D. F., MacKenty, J. W., Robberto, M., et al. 2006, ApJ, 643, 1166 [NASA ADS] [CrossRef] [Google Scholar]
- Francois, P., Inno, L., Laney, C. D., et al. 2013, A&A, 554, A132 [NASA ADS] [CrossRef] [EDP Sciences] [Google Scholar]
- Gaia Collaboration (Brown, A. G. A., et al.) 2018, A&A, 616, A1 [NASA ADS] [CrossRef] [EDP Sciences] [Google Scholar]
- Geballe, T. R., Najarro, F., Figer, D. F., Schlegelmilch, B. W., \& de La Fuente, D. 2011, Nature, 470, 200 [NASA ADS] [CrossRef] [Google Scholar]
- Genovali, K., Lemasle, B., Bono, G., et al. 2013, Nature, 479, 7372 [Google Scholar]
- Gonzalez-Fernandez, C., & Negueruela, I. 2012, A&A, 539, A100 [NASA ADS] [CrossRef] [EDP Sciences] [Google Scholar]
- Grevesse, N., & Sauval, A. J. 1998, Space Sci. Rev., 85, 161 [NASA ADS] [CrossRef] [Google Scholar]
- Gustafsson, B., Edvardsson, B., Eriksson, K., et al. 2008, A&A, 486, 951 [NASA ADS] [CrossRef] [EDP Sciences] [Google Scholar]
- Hamano, S., Kobayashi, N., Kondo, S., et al. 2015, ApJ, 800, 137 [NASA ADS] [CrossRef] [Google Scholar]
- Hamano, S., Kobayashi, N., Kondo, S., et al. 2016, ApJ, 821, 42 [NASA ADS] [CrossRef] [Google Scholar]
- Jönsson, H., Ryde, N., Harper, G. M., et al. 2014, A&A, 564, A122 [NASA ADS] [CrossRef] [EDP Sciences] [Google Scholar]
- Levesque, E. M., Massey, P., Olsen, K. A. G., et al. 2005, ApJ, 628, 973 [NASA ADS] [CrossRef] [Google Scholar]
- Melendez, J., & Barbuy, B. 1999, ApJS, 124, 527 [NASA ADS] [CrossRef] [MathSciNet] [Google Scholar]
- Negueruela, I., Gonzalez-Fernandez, C., Marco, A., Clark, J. S., & Martinez-Nunez, S. 2010, A&A, 513, A74 [NASA ADS] [CrossRef] [EDP Sciences] [Google Scholar]
- Negueruela, I., Gonzalez-Fernandez, C., Marco, A., & Clark, J. S. 2011, A&A, 528, A59 [Google Scholar]
- Oliva, E., Origlia, L., Maiolino, R., et al. 2012a, SPIE, 8446E, 3TO [Google Scholar]
- Oliva, E., Biliotti, V., Baffa, C., et al. 2012b, SPIE, 8453E, 2TO [Google Scholar]
- Oliva, E., Origlia, L., Maiolino, R., et al. 2013, A&A, 555, A78 [NASA ADS] [CrossRef] [EDP Sciences] [Google Scholar]
- Oliva, E., Sanna, N., Rainer, M., et al. 2018, SPIE, 10702, 1070274 [Google Scholar]
- Origlia, L., Moorwood, A. F. M., & Oliva, E. 1993, A&A, 280, 536 [NASA ADS] [Google Scholar]
- Origlia, L., Rich, R. M., & Castro, S. 2002, AJ, 123, 1559 [NASA ADS] [CrossRef] [Google Scholar]
- Origlia, L., Oliva, E., Maiolino, R., et al. 2013, A&A, 560, A46 [NASA ADS] [CrossRef] [EDP Sciences] [Google Scholar]
- Origlia, L., Oliva, E., Baffa, C., et al. 2014, SPIE, 914461E, 1EO [Google Scholar]
- Origlia, L., Oliva, E., Sanna, N., et al. 2016, A&A, 585, A14 [NASA ADS] [CrossRef] [EDP Sciences] [Google Scholar]
- Rainer, M., Harutyunyan, A., Carleo, I., et al. 2018, SPIE, 10702, 1070266 [Google Scholar]
- Ramírez, R. V., Sellgren, K., Carr, J. S., et al. 2000, AJ, 537, 205 [Google Scholar]
- Roman-Duval, G., Jackson, J. M., Heyer, M., et al. 2009, ApJ, 699, 1153 [NASA ADS] [CrossRef] [Google Scholar]
- Schönrich, R., Binney, J., & Dehnen, W. 2010, MNRAS, 403, 1829 [NASA ADS] [CrossRef] [Google Scholar]
- Spina, L., Randich, S., Magrini, L., et al. 2017, A&A, 601, A70 [NASA ADS] [CrossRef] [EDP Sciences] [Google Scholar]
- Tozzi, A., Oliva, E., Origlia, L., et al. 2014, SPIE, 9147, 91479N [Google Scholar]
- Tozzi, A., Oliva, E., Iuzzolino, M., et al. 2016, SPIE, 9908, 99086C [Google Scholar]
All Tables
RSG stars in the Alicante 7 and Alicante 10 associations of RSGC3 observed with GIANO-B.
Chemical abundances ([X/H]) of the RSG stars in the Alicante 7 and Alicante 10 associations observed with GIANO-B.
All Figures
|
Fig. 1. Portion of the normalized telluric corrected spectra, showing the prominent DIB feature at 1317.8 nm. The dashed purple line is the telluric correction applied to the data. |
| In the text | |
|
Fig. 2. Gaia DR2 proper motions for the observed stars in Alicante 7 (left panel) and Alicante 10 (right panel). The red dot indicates star N03, whose kinematics is inconsistent with being a member of the Alicante 10 association. |
| In the text | |
|
Fig. 3. Derived [X/H] chemical abundances and corresponding errors for the observed RSGs candidate members of the Alicante 7 (seven stars) and Alicante 10 (three stars) associations. Dotted lines mark the average [Fe/H] values in each association. |
| In the text | |
|
Fig. 4. Derived average [X/H] chemical abundances and corresponding errors for the observed RSGs, candidate members of the Alicante 7 and Alicante 10 associations. Dotted lines mark the average [Fe/H] values in each association. |
| In the text | |
|
Fig. 5. Derived average [X/H] chemical abundances and corresponding errors for the observed RSGs, candidate members of the Alicante 7 and Alicante 10 associations. |
| In the text | |
Current usage metrics show cumulative count of Article Views (full-text article views including HTML views, PDF and ePub downloads, according to the available data) and Abstracts Views on Vision4Press platform.
Data correspond to usage on the plateform after 2015. The current usage metrics is available 48-96 hours after online publication and is updated daily on week days.
Initial download of the metrics may take a while.