Fig. 15.
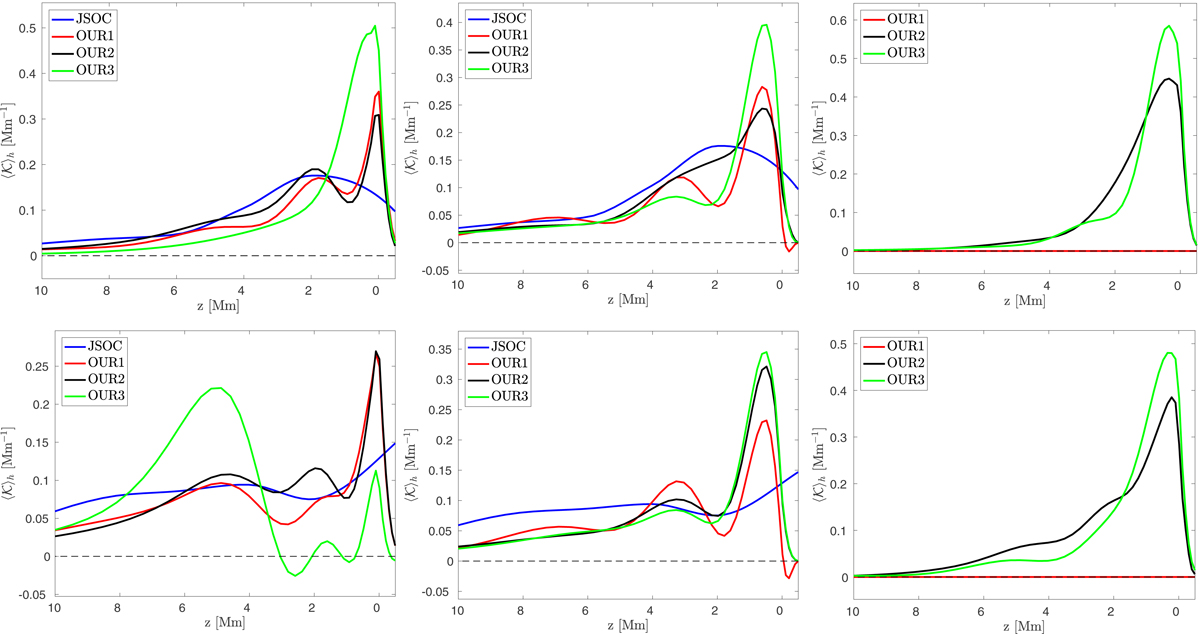
Examples of the horizontally averaged averaging kernels as a function of depth. First and second rows: kernels for the depths of 0–1 Mm (or 0.5 Mm for our inversion) and 5–7 Mm (6.0 Mm depth), respectively. Left-most column: kernel for vx. Middle: kernel for δcs. Right-most column: kernel for vertical vz. We note that the averaging kernels for the vz inversion using a JSOC-like inversion (denoted as OUR1) have vanishing horizontal intergals because only the difference travel-time geometries were employed (Burston et al. 2015).
Current usage metrics show cumulative count of Article Views (full-text article views including HTML views, PDF and ePub downloads, according to the available data) and Abstracts Views on Vision4Press platform.
Data correspond to usage on the plateform after 2015. The current usage metrics is available 48-96 hours after online publication and is updated daily on week days.
Initial download of the metrics may take a while.