Fig. 1.
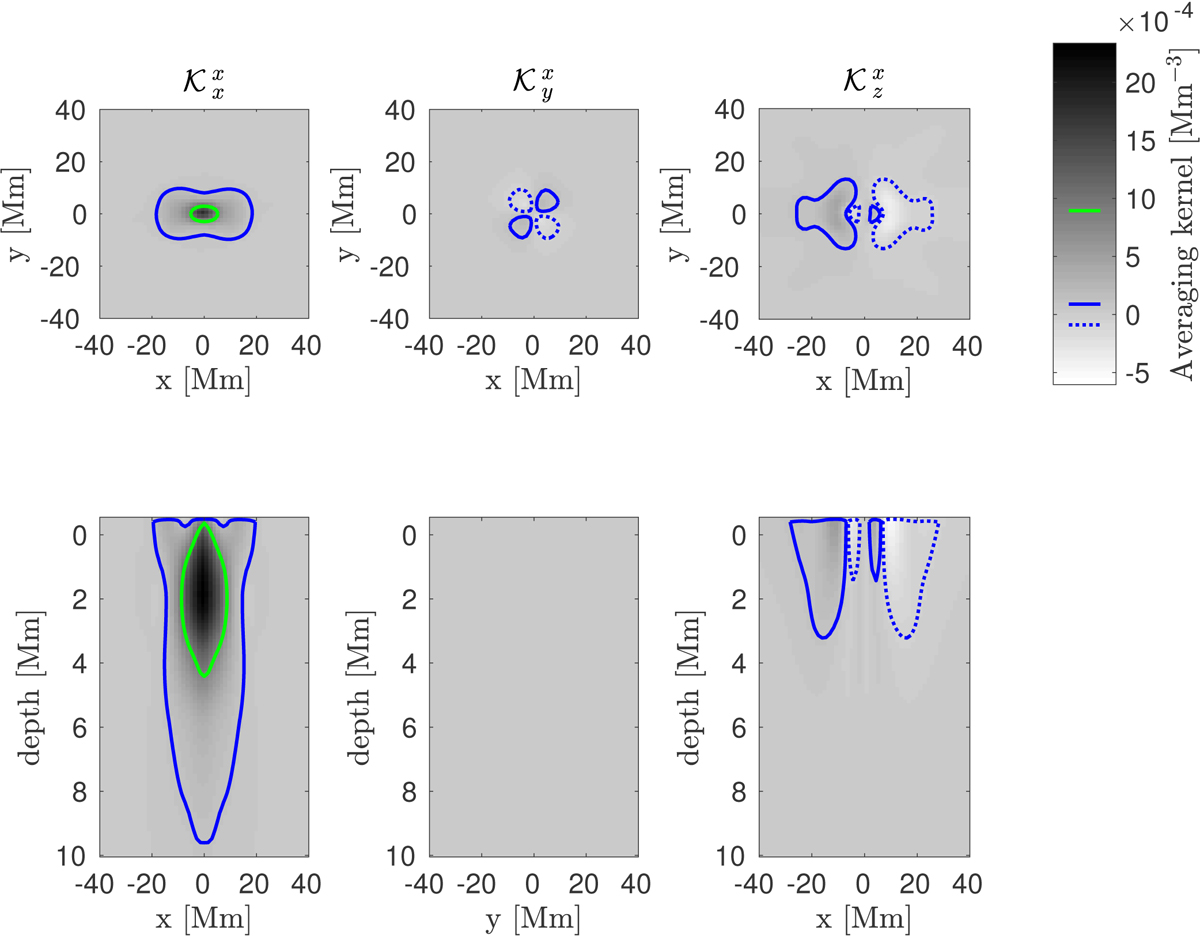
JSOC averaging kernel for vx inversion at the depth of 0–1 Mm. The columns indicate the contributions from the individual quantities considered in the inversion, the terms not in the direction of the inversion indicate the leakage of the other quantities – the cross-talk. The solid green curve corresponds to the half-maximum of the averaging kernel at the target depth, the blue solid and blue dotted lines correspond to +5% and −5% of the maximum of the averaging kernel at the target depth, respectively. In some plots of this kind the green dotted and the red solid lines are also present, which correspond to minus half-maximum of the averaging kernel at the target depth and to the half-maximum of the target function at the target depth, respectively. In the top row, there are horizontal slices of the averaging kernel at the target depth and in the bottom row, there are vertical slices perpendicular to the symmetries.
Current usage metrics show cumulative count of Article Views (full-text article views including HTML views, PDF and ePub downloads, according to the available data) and Abstracts Views on Vision4Press platform.
Data correspond to usage on the plateform after 2015. The current usage metrics is available 48-96 hours after online publication and is updated daily on week days.
Initial download of the metrics may take a while.