Fig. 8.
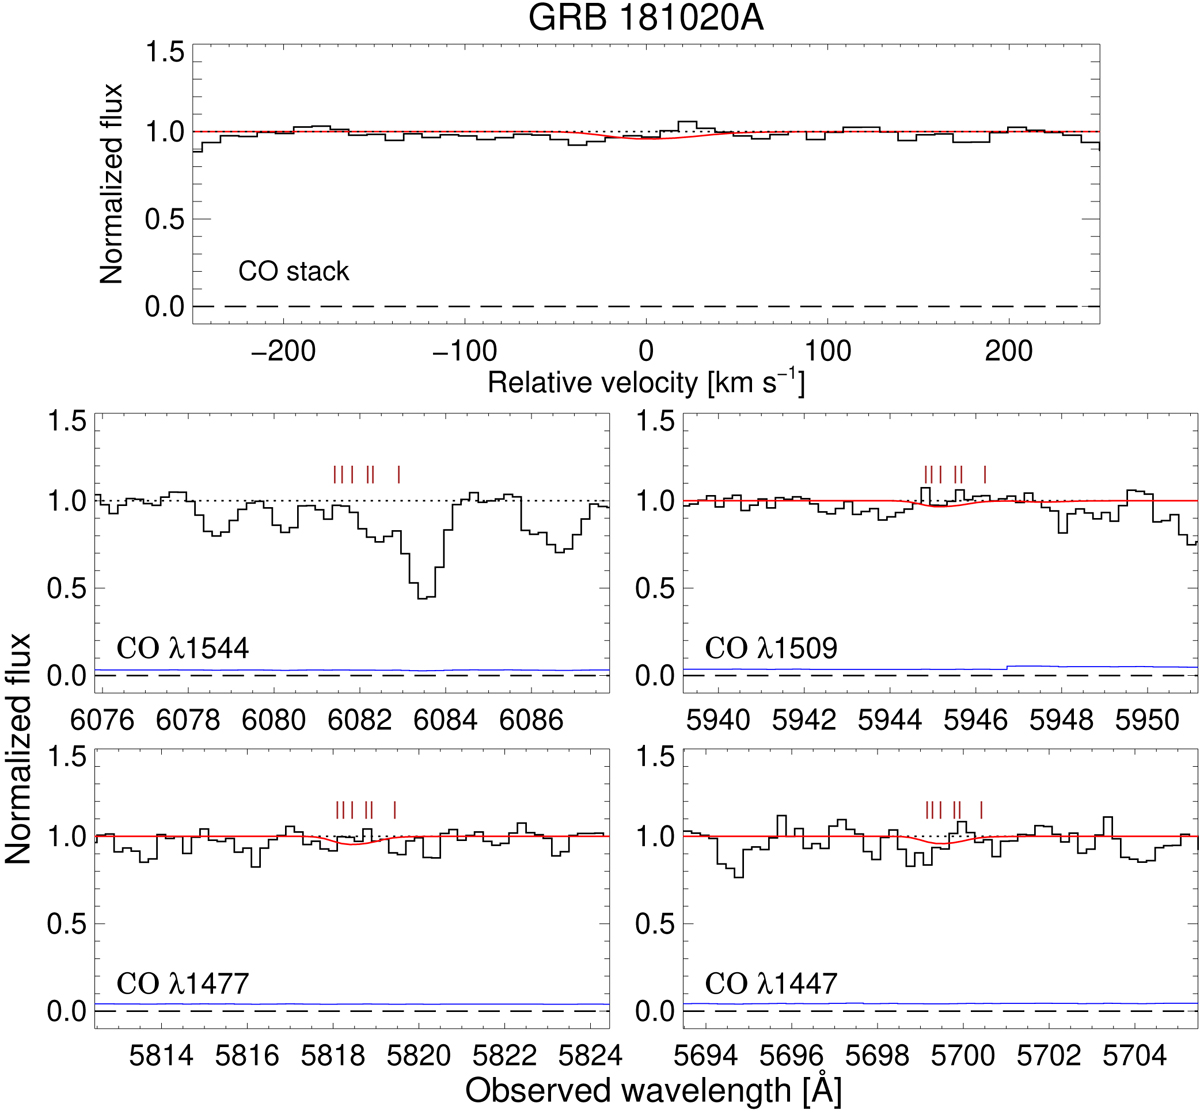
Normalized VLT/X-shooter VIS arm spectrum of GRB 181020A showing the regions where the strongest CO band absorption lines are expected including a stacked spectrum (excluding CO λ 1544). Again, the solid black lines show the data and the blue lines the associated error. Line profiles showing the derived upper limits on N(CO) are overplotted in red.
Current usage metrics show cumulative count of Article Views (full-text article views including HTML views, PDF and ePub downloads, according to the available data) and Abstracts Views on Vision4Press platform.
Data correspond to usage on the plateform after 2015. The current usage metrics is available 48-96 hours after online publication and is updated daily on week days.
Initial download of the metrics may take a while.