Fig. 7.
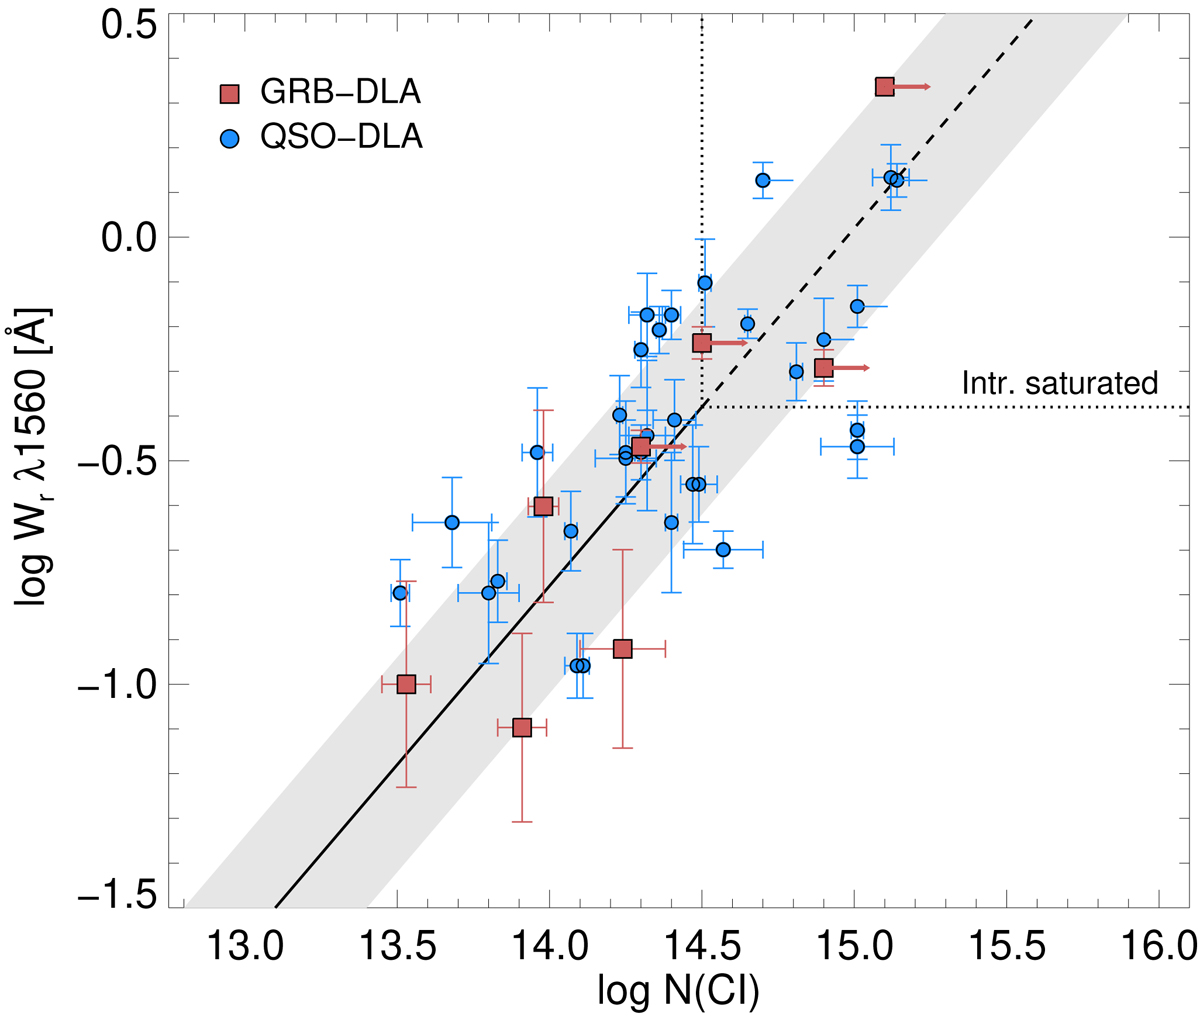
C Iλ 1560 rest-frame equivalent width as a function of total C I column density. Red squares denote GRB C I absorbers from this work. Blue dots show the C I-selected quasar absorbers from Ledoux et al. (2015), for which Noterdaeme et al. (2018) measured the total N(C I) from high-resolution spectroscopy. The black line shows the best linear fit where the σ = 0.3 dex scatter is shown by the gray-shaded region. The approximate column density (and equivalent width) at which the intrinsic C I lines saturate are marked by the dotted lines.
Current usage metrics show cumulative count of Article Views (full-text article views including HTML views, PDF and ePub downloads, according to the available data) and Abstracts Views on Vision4Press platform.
Data correspond to usage on the plateform after 2015. The current usage metrics is available 48-96 hours after online publication and is updated daily on week days.
Initial download of the metrics may take a while.