Fig. 5.
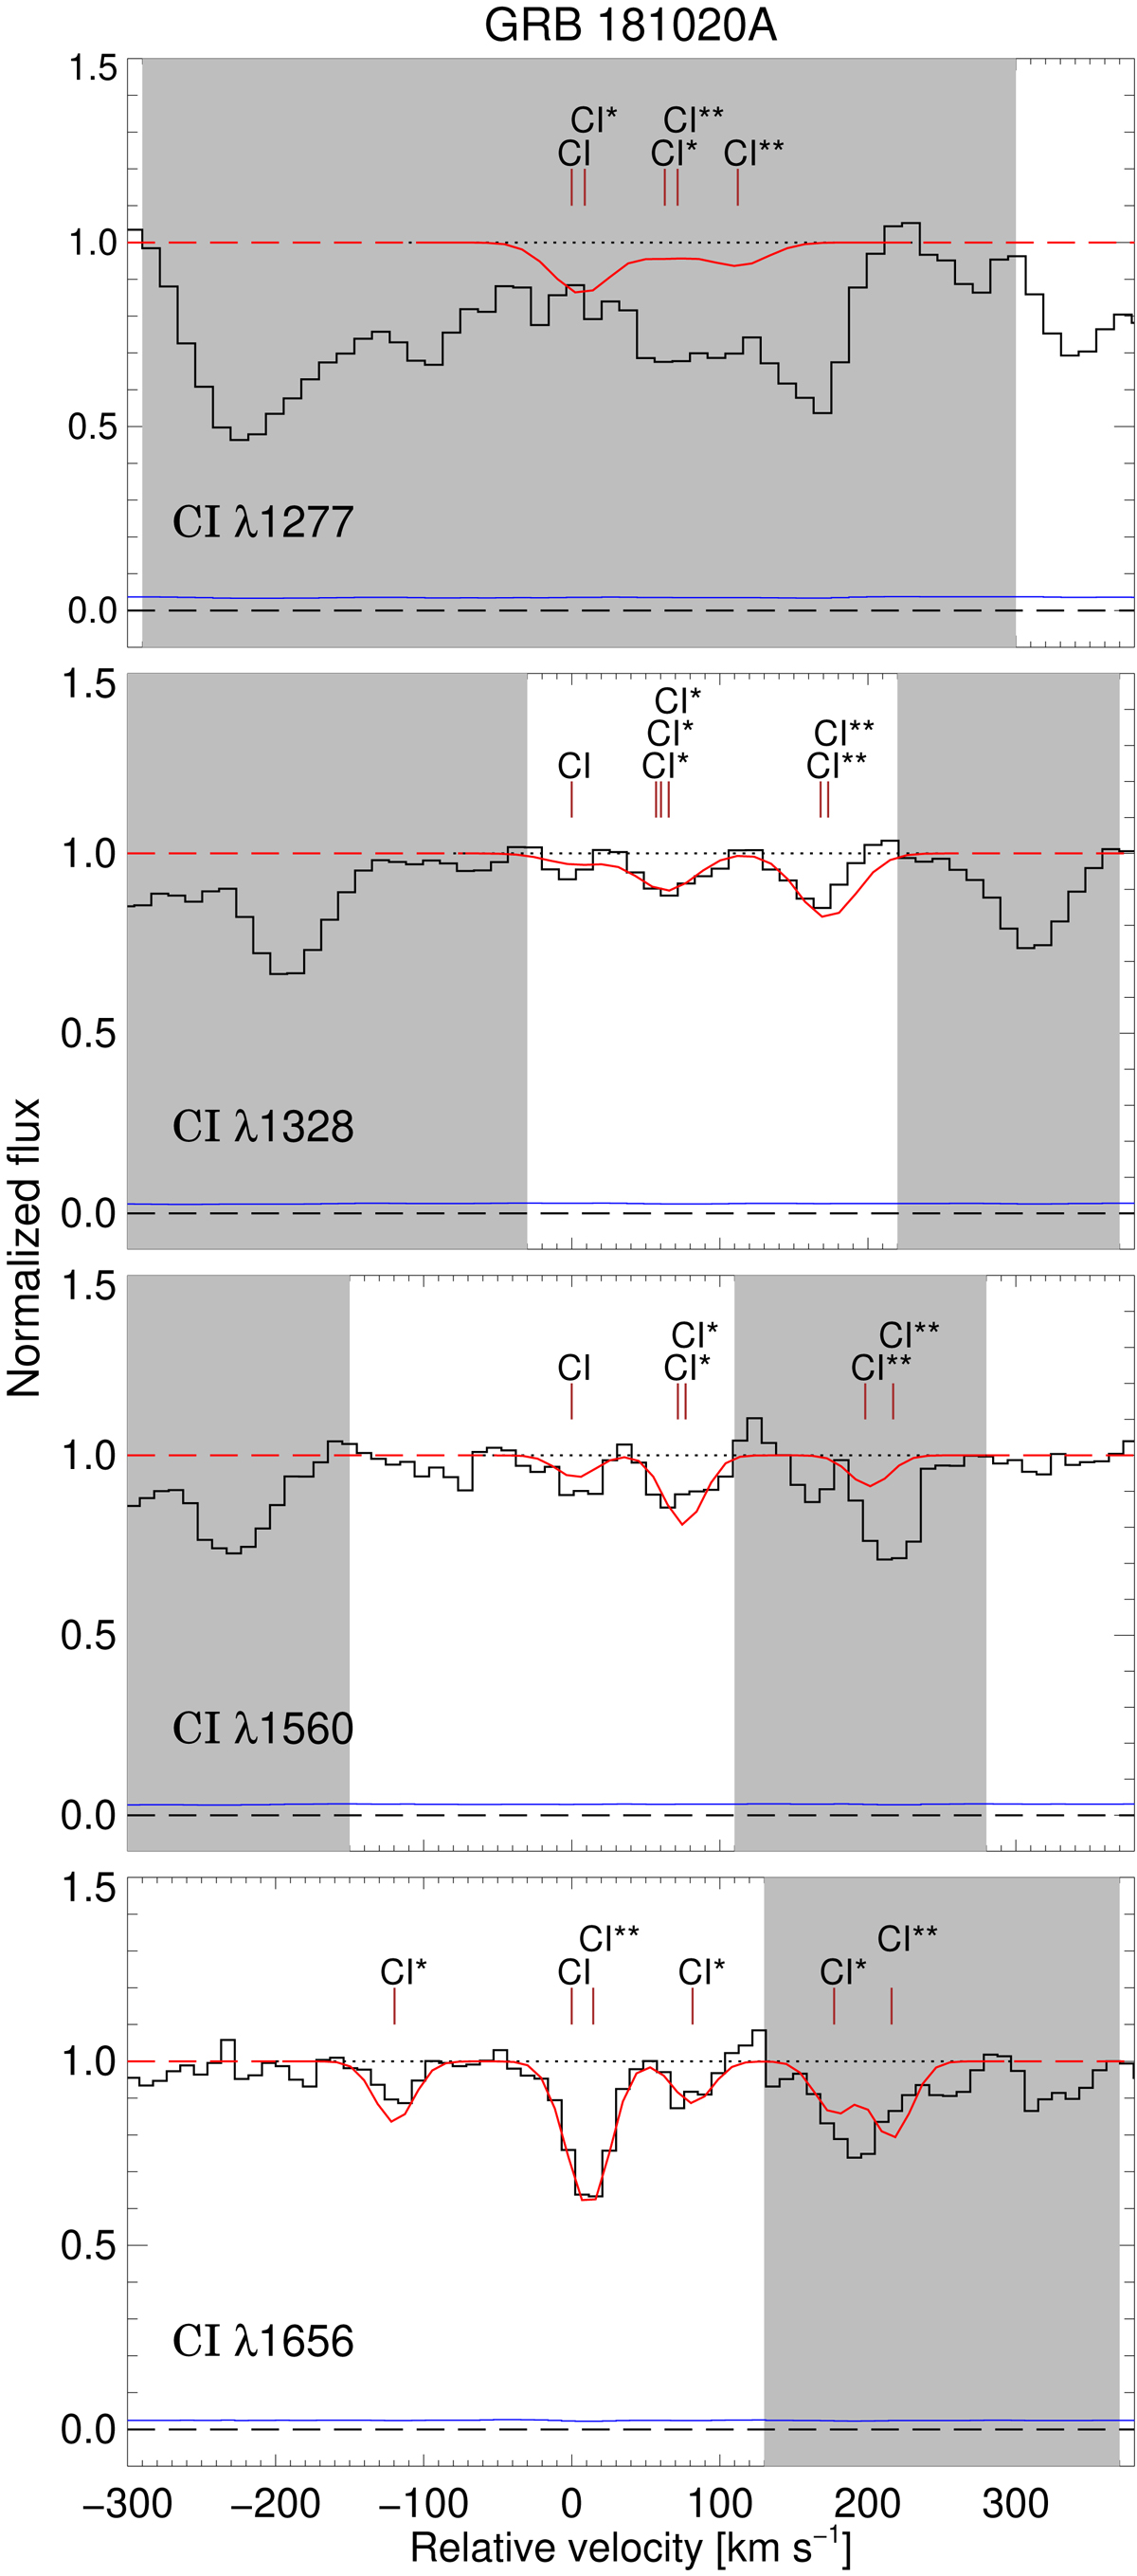
Normalized VLT/X-shooter VIS arm spectrum of GRB 181020A in velocity space, centered on the ground-state transition of C I at z = 2.93786. Again, the solid black lines show the data, the blue lines the associated error and the red lines the best-fit model. The C I ground-state and excited line transitions are marked above each of the absorption profiles. Gray shaded regions were ignored in the fit.
Current usage metrics show cumulative count of Article Views (full-text article views including HTML views, PDF and ePub downloads, according to the available data) and Abstracts Views on Vision4Press platform.
Data correspond to usage on the plateform after 2015. The current usage metrics is available 48-96 hours after online publication and is updated daily on week days.
Initial download of the metrics may take a while.