Fig. A.3.
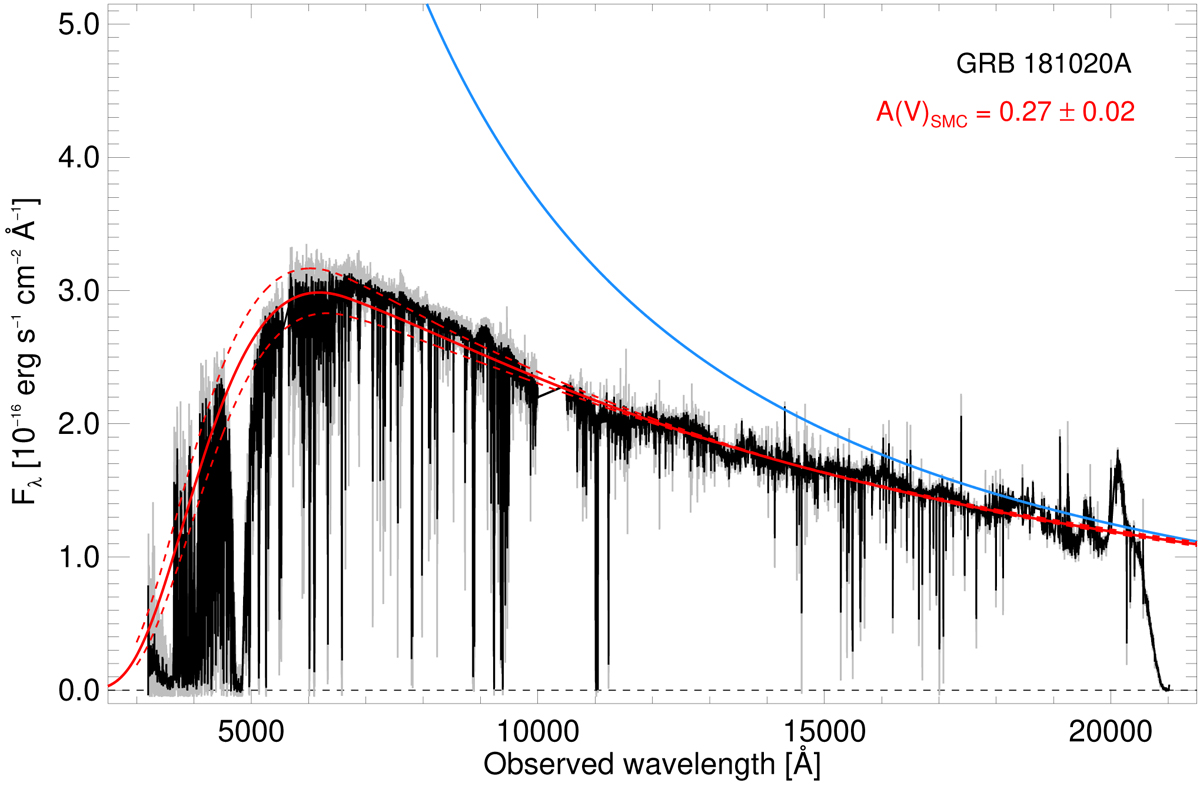
Extinction curve fit for GRB 181020A. The raw combined VLT/X-shooter spectrum is shown in gray, overplotted with a binned version to enhance the continuum trace. The best-fit SMC-like extinction with AV = 0.27 ± 0.02 mag is shown by the solid red line, where the error on the fit is shown by the dashed red lines. The best-fit intrinsic spectral slope is overplotted as the solid blue line.
Current usage metrics show cumulative count of Article Views (full-text article views including HTML views, PDF and ePub downloads, according to the available data) and Abstracts Views on Vision4Press platform.
Data correspond to usage on the plateform after 2015. The current usage metrics is available 48-96 hours after online publication and is updated daily on week days.
Initial download of the metrics may take a while.