Fig. A.1.
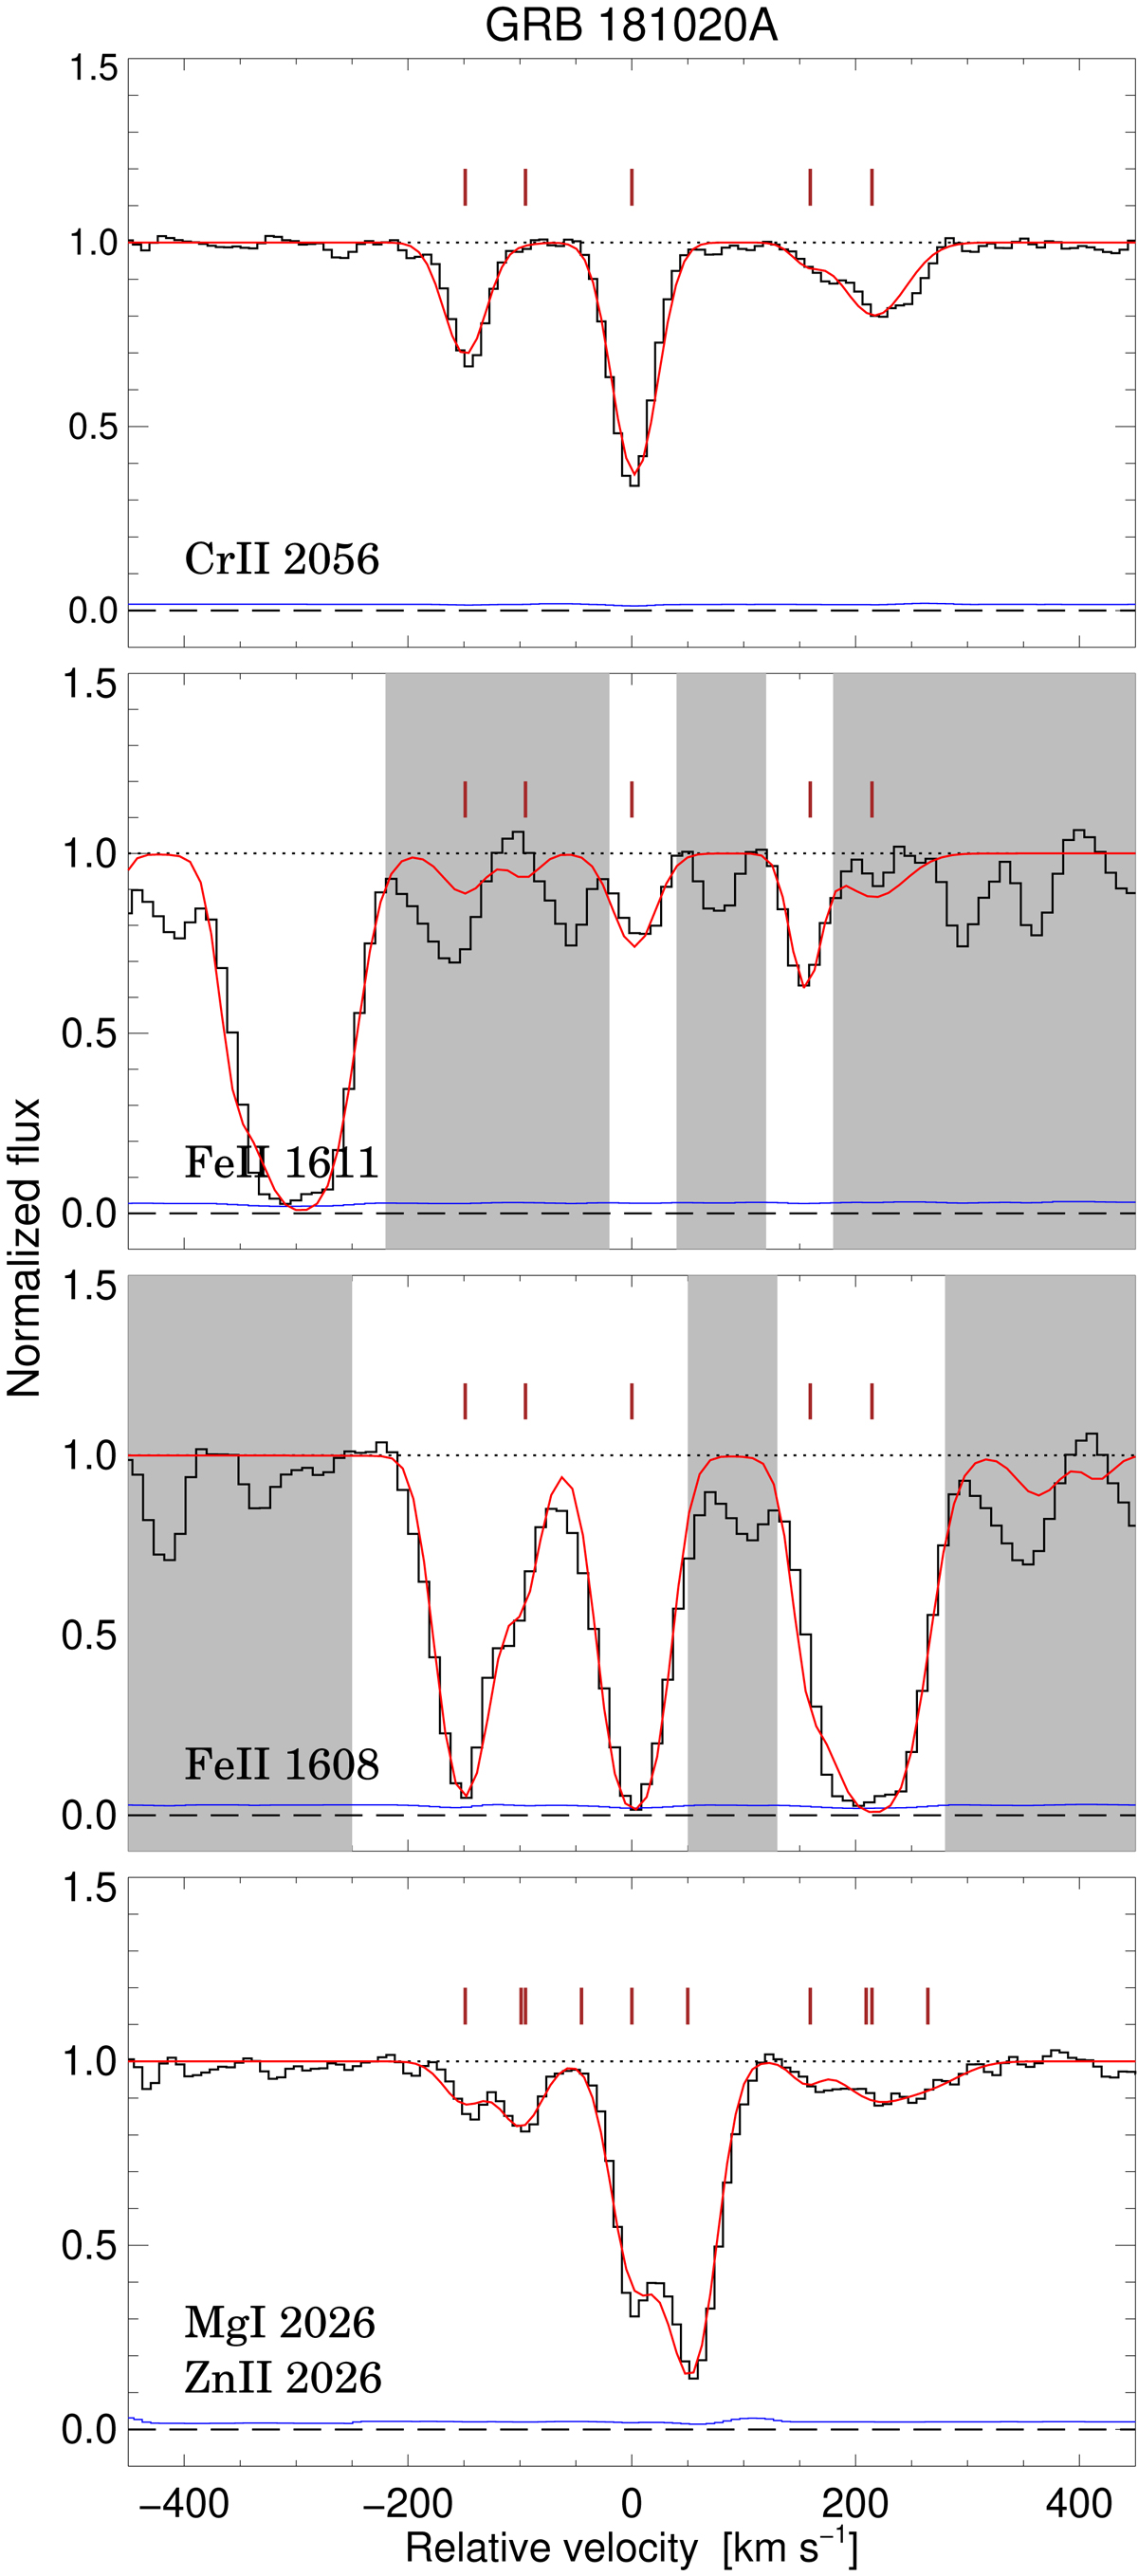
Normalized VLT/X-shooter spectrum of GRB 181020A in velocity space, centered on the strongest component at z = 2.9379. The solid black line shows the spectrum and the associated error is shown in blue. The best-fit Voigt profiles are indicated by the solid red lines. The identified velocity components are marked above each of the absorption profiles. Gray shaded regions were ignored in the fit. These lines are representative of the typical low-ionization metal lines in GRB 181020A, showing most clearly the overall velocity structure.
Current usage metrics show cumulative count of Article Views (full-text article views including HTML views, PDF and ePub downloads, according to the available data) and Abstracts Views on Vision4Press platform.
Data correspond to usage on the plateform after 2015. The current usage metrics is available 48-96 hours after online publication and is updated daily on week days.
Initial download of the metrics may take a while.