Fig. 14.
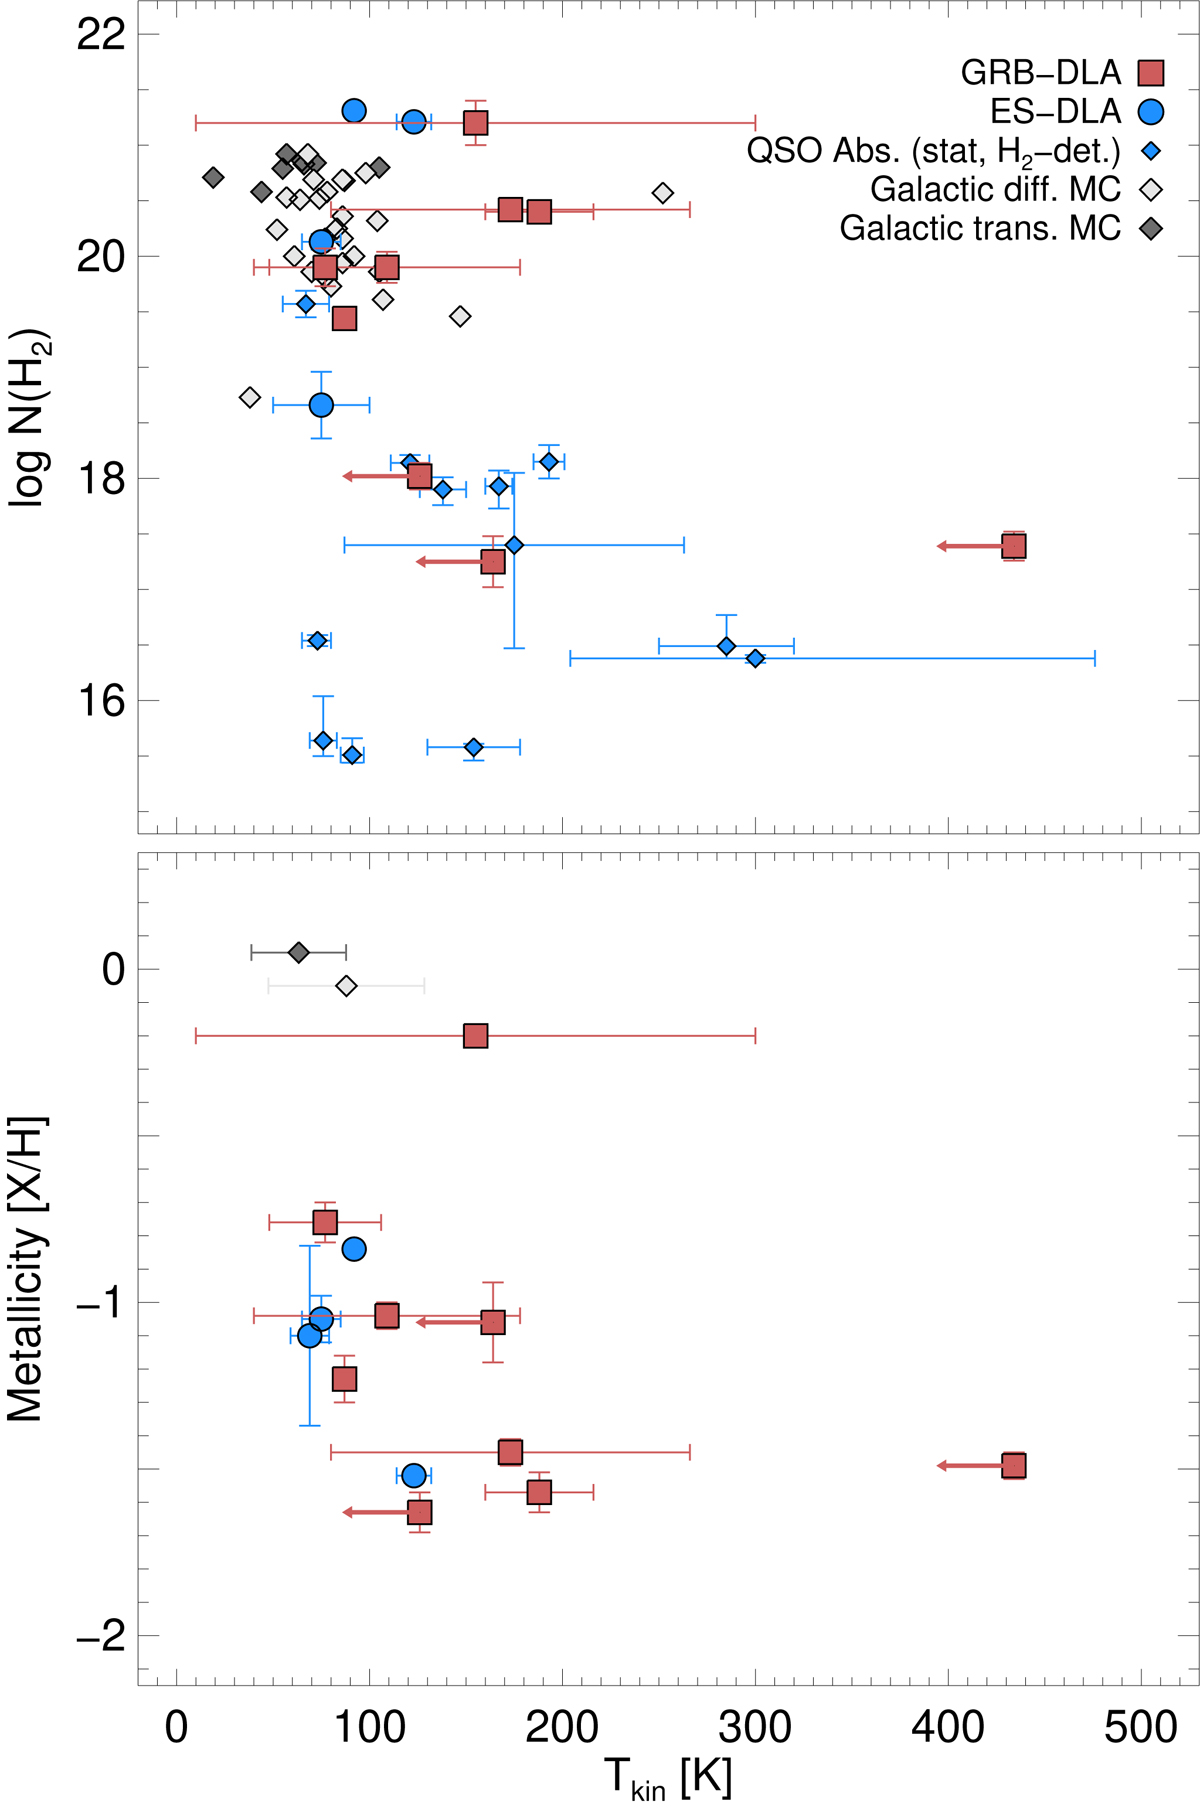
Measurements of the kinetic temperature from the H2 rotational excited states as a function of total H2 column density (top) and metallicity (bottom). Red squares represent the GRBs from this work, where the arrows mark the upper limits on Tkin derived from T12 (see text). The small blue diamond symbols denote quasar DLAs from the sample studied by Srianand et al. (2005), where large blue dots represent the same ES-DLAs shown in Fig. 10. The gray-shaded diamond symbols in the top panel again show selected sightlines through diffuse and translucent molecular clouds in the Milky Way (from Burgh et al. 2010). In the bottom panel, only the strongest DLAs with N(H I) > 1021.7 cm−2 are shown. The gray-shaded diamond symbols here represent the mean Tkin for Galactic diffuse and translucent molecular clouds (with error bars denoting the standard deviation), arbitrarily placed at solar metallicities.
Current usage metrics show cumulative count of Article Views (full-text article views including HTML views, PDF and ePub downloads, according to the available data) and Abstracts Views on Vision4Press platform.
Data correspond to usage on the plateform after 2015. The current usage metrics is available 48-96 hours after online publication and is updated daily on week days.
Initial download of the metrics may take a while.