Fig. 12.
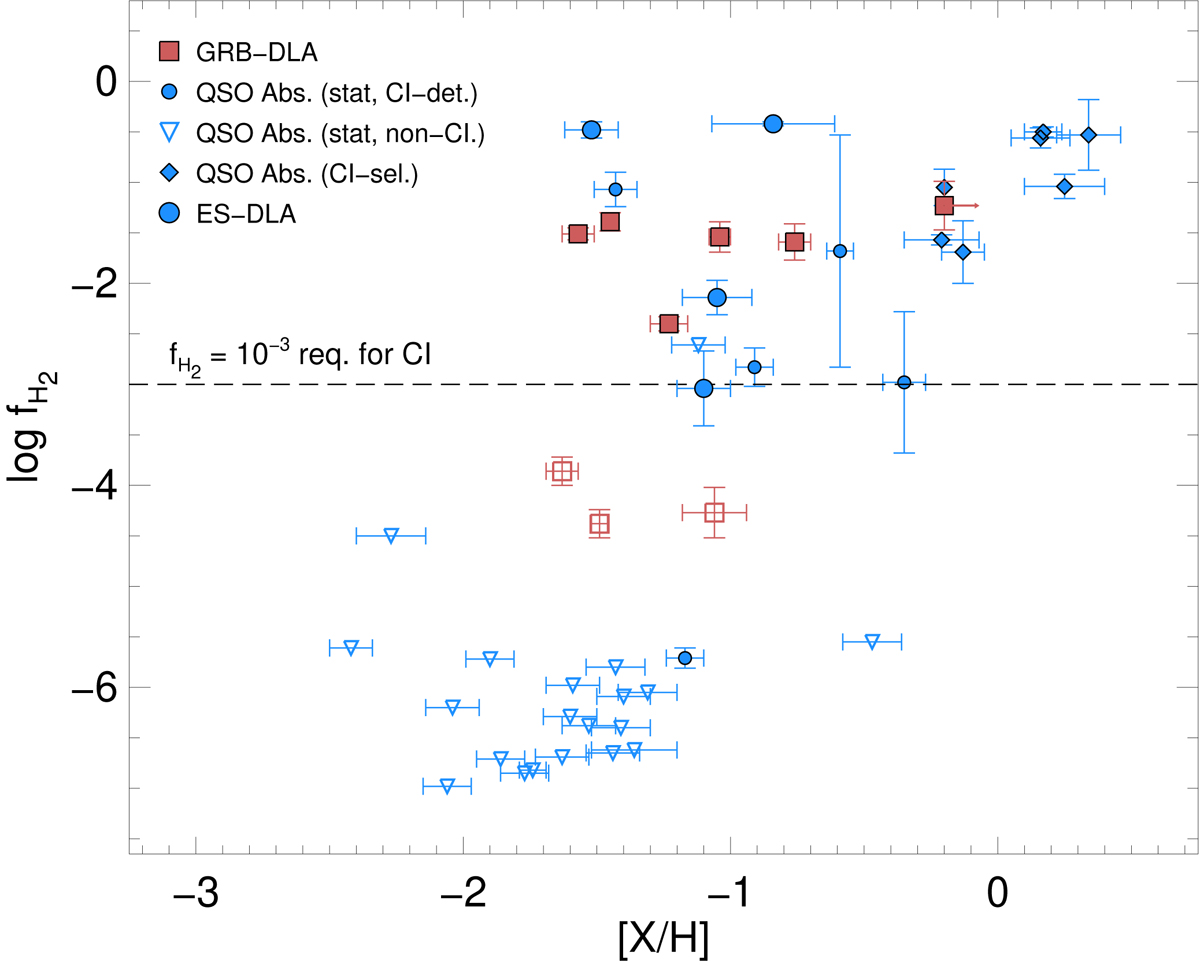
Molecular-hydrogen fraction as a function of metallicity for the H2-bearing GRB absorbers (red). Filled squares denote GRBs where C I is also detected, whereas empty squares represent GRBs with H2 but non-detections of C I. The statistical sample of quasar absorbers from Ledoux et al. (2003) are shown as the small blue symbols where circles denote absorbers with H2 detections and triangles show the upper limits on the molecular-hydrogen fractions of the absorbers with non-detections of H2. Filled blue symbols denote quasar absorbers where Srianand et al. (2005) detected C I in absorption, whereas empty blue symbols represent quasar absorbers with non-detections of C I. For comparison, the C I-selected quasar absorbers with measurements of C I, H2 (Noterdaeme et al. 2018) and metallicities from the literature, are shown as the filled blue diamond symbols. The large blue dots represent the same ES-DLAs as shown in Fig. 10.
Current usage metrics show cumulative count of Article Views (full-text article views including HTML views, PDF and ePub downloads, according to the available data) and Abstracts Views on Vision4Press platform.
Data correspond to usage on the plateform after 2015. The current usage metrics is available 48-96 hours after online publication and is updated daily on week days.
Initial download of the metrics may take a while.