Fig. 1.
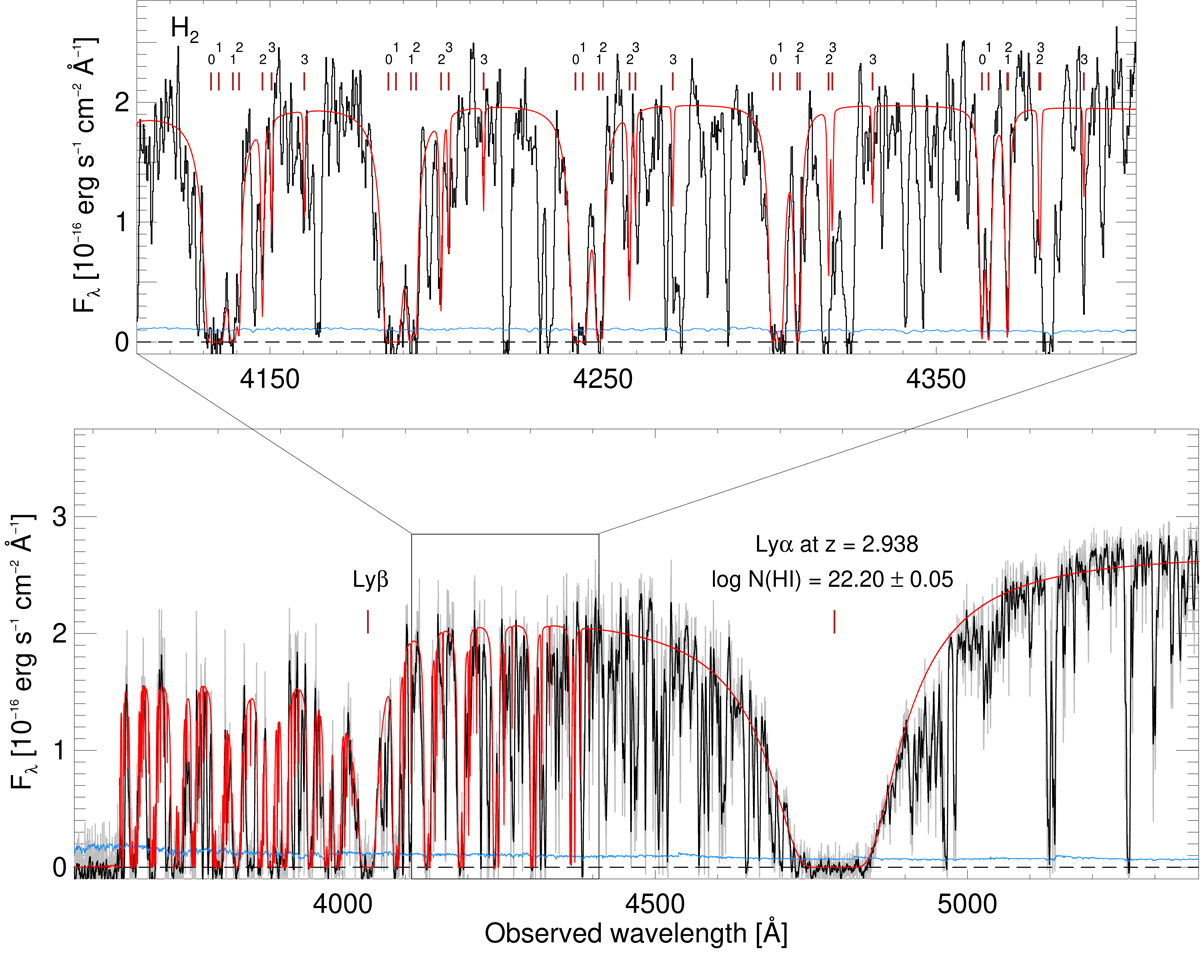
VLT/X-shooter UVB arm spectrum of GRB 181020A. The absorption features from the H I Lyα, Lyβ and H2 Lyman-Werner band line transitions are clearly shown. The raw spectrum is shown in gray with the associated error spectrum in blue. A binned version of the spectrum is overplotted in black. A synthetic spectrum of the best fit model to H I and H2 is shown as the solid red line and the Lyα and Lyβ absorption features are marked at the observed redshift of z = 2.938. Top panel: a zoom-in of a subset of the most constraining Lyman-Werner band line transitions from molecular hydrogen. The redshifted wavelengths of the strongest rotational levels J = 0, 1, 2, 3 are marked above each line.
Current usage metrics show cumulative count of Article Views (full-text article views including HTML views, PDF and ePub downloads, according to the available data) and Abstracts Views on Vision4Press platform.
Data correspond to usage on the plateform after 2015. The current usage metrics is available 48-96 hours after online publication and is updated daily on week days.
Initial download of the metrics may take a while.