Fig. A.1.
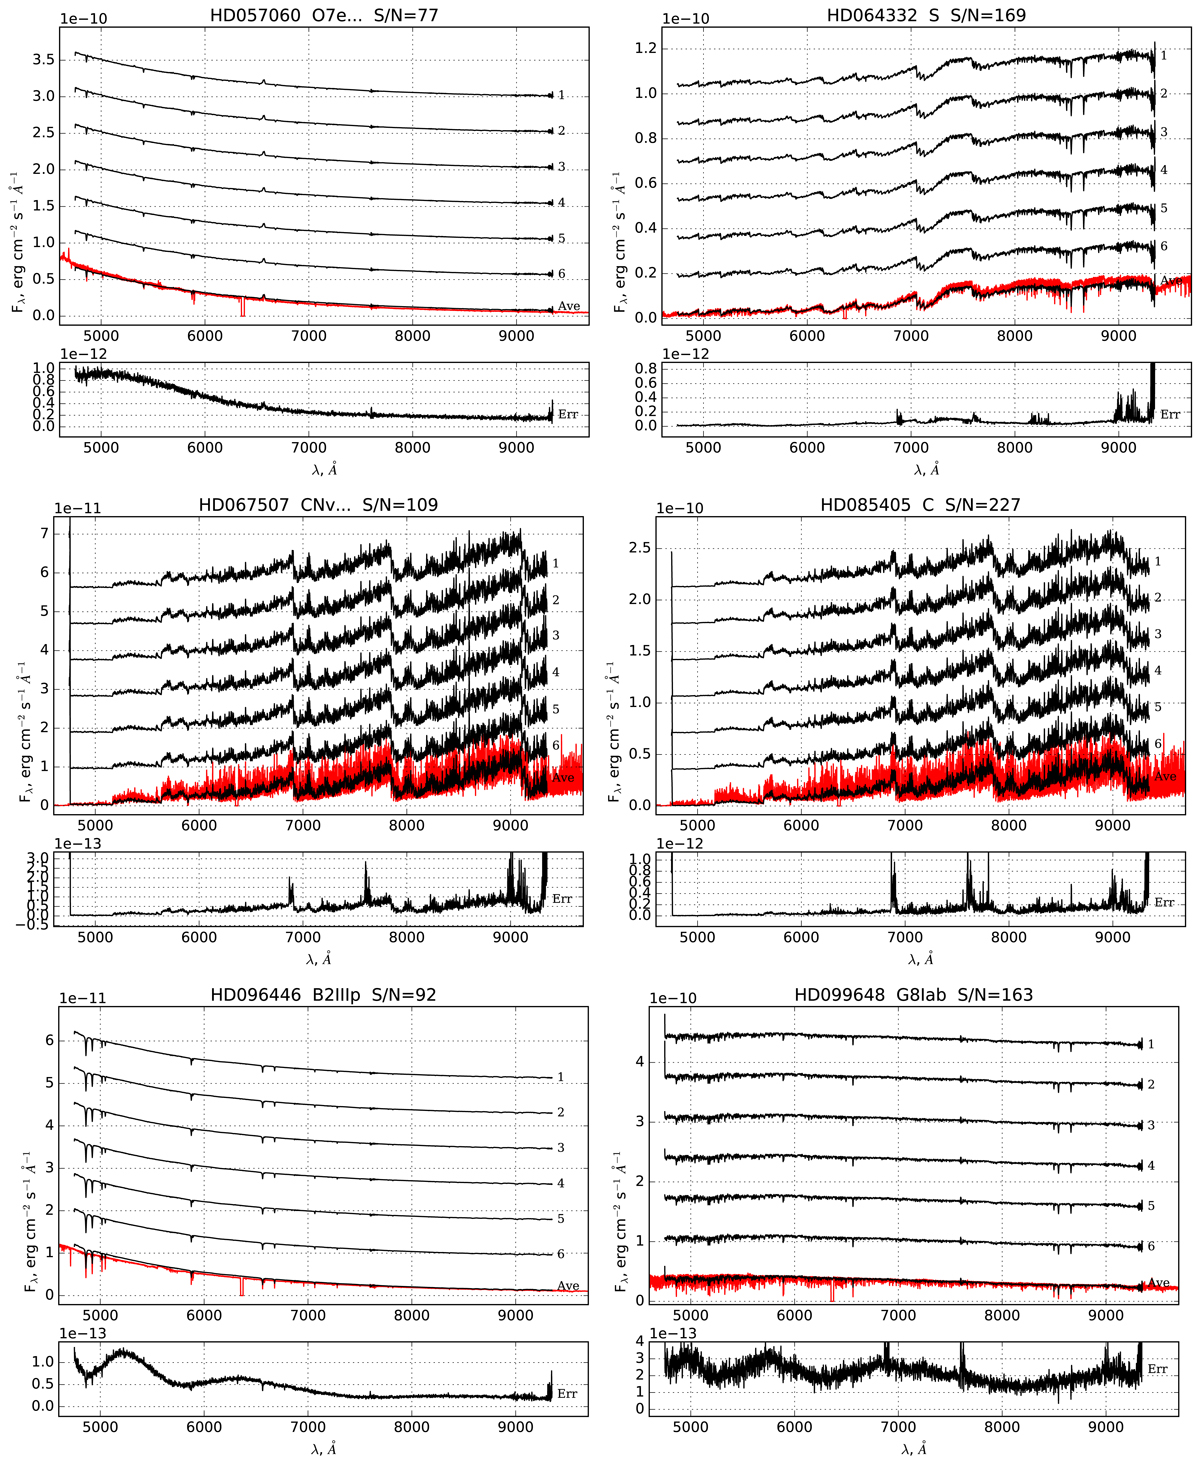
MUSE spectra (labeled on the top of each panel). Upper sub-panels: spectra extracted from each individual exposure (shifted up for clarity) and the average spectra of the object at its true flux level. The XSL spectra, when available, are plotted in red underneath the averaged MUSE spectrum. Bottom sub-panels: standard deviation of the average spectrum. The spectra of all stars are available at the CDS.
Current usage metrics show cumulative count of Article Views (full-text article views including HTML views, PDF and ePub downloads, according to the available data) and Abstracts Views on Vision4Press platform.
Data correspond to usage on the plateform after 2015. The current usage metrics is available 48-96 hours after online publication and is updated daily on week days.
Initial download of the metrics may take a while.