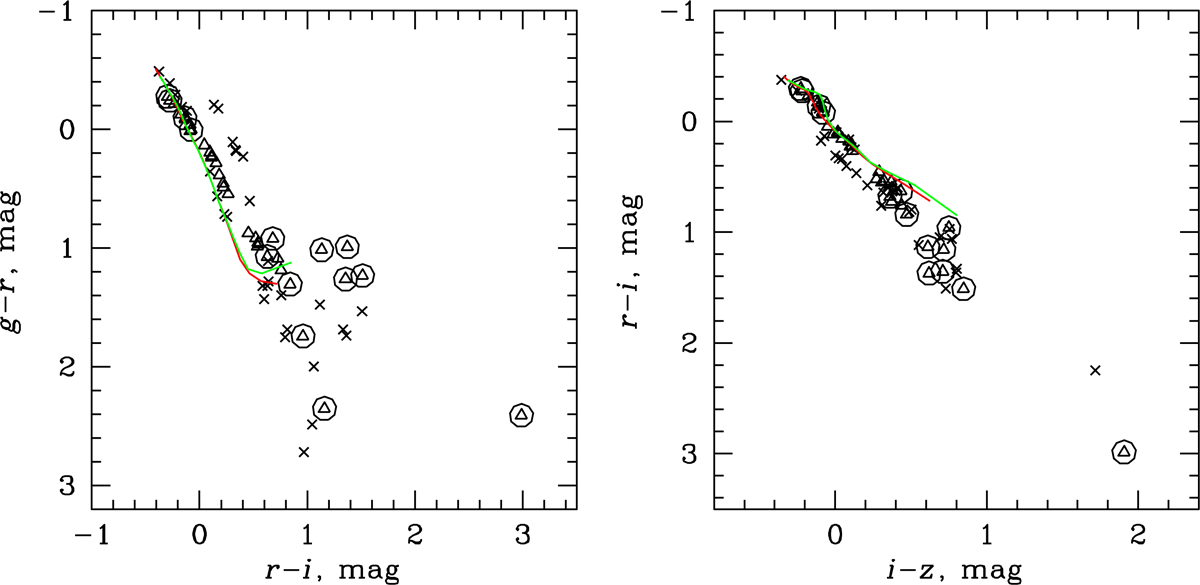
Fig. 5.

Synthetic SDSS color-color diagrams derived from the MUSE (open circles) and XSL (open triangles) spectra. Larger open circles mark known variables, according to the SIMBAD database. and although many stars are variable, some distinct outliers are not. Sequences for solar abundance dwarfs (red line) and giant (green line) stars from Lenz et al. (1998) are also shown. The extreme red outliers are IRAS 15060+0947 (V* FV Boo) – a known Mira variable. There are two points for this object on the right panel – they correspond to the XSL and the MUSE spectra.
Current usage metrics show cumulative count of Article Views (full-text article views including HTML views, PDF and ePub downloads, according to the available data) and Abstracts Views on Vision4Press platform.
Data correspond to usage on the plateform after 2015. The current usage metrics is available 48-96 hours after online publication and is updated daily on week days.
Initial download of the metrics may take a while.


