Fig. 3.
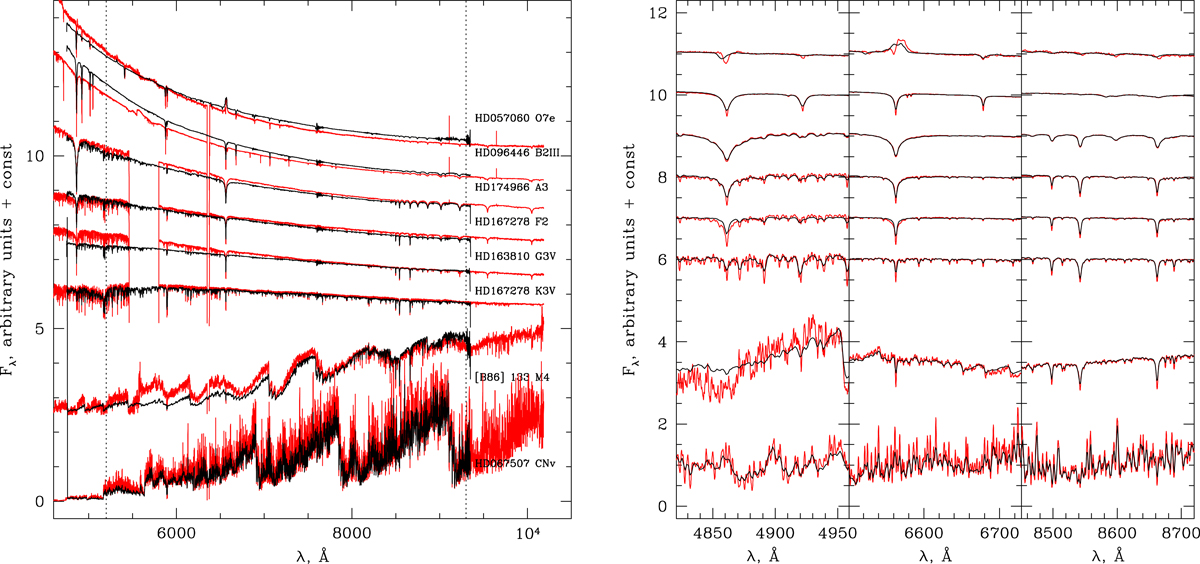
Comparison of a subset of our MUSE spectra (black lines) with the XSL spectra (red lines; boxcar smoothed over 8 pixels). The spectra are normalized to unity between the two vertical dotted lines shown on the left panel, and shifted vertically for display purposes. Left panel: entire MUSE spectral range, right panel: zoom onto the Hβ, Hα, and Ca triplet wavelength ranges (left to right). No radial velocity corrections are applied.
Current usage metrics show cumulative count of Article Views (full-text article views including HTML views, PDF and ePub downloads, according to the available data) and Abstracts Views on Vision4Press platform.
Data correspond to usage on the plateform after 2015. The current usage metrics is available 48-96 hours after online publication and is updated daily on week days.
Initial download of the metrics may take a while.