Fig. 2.
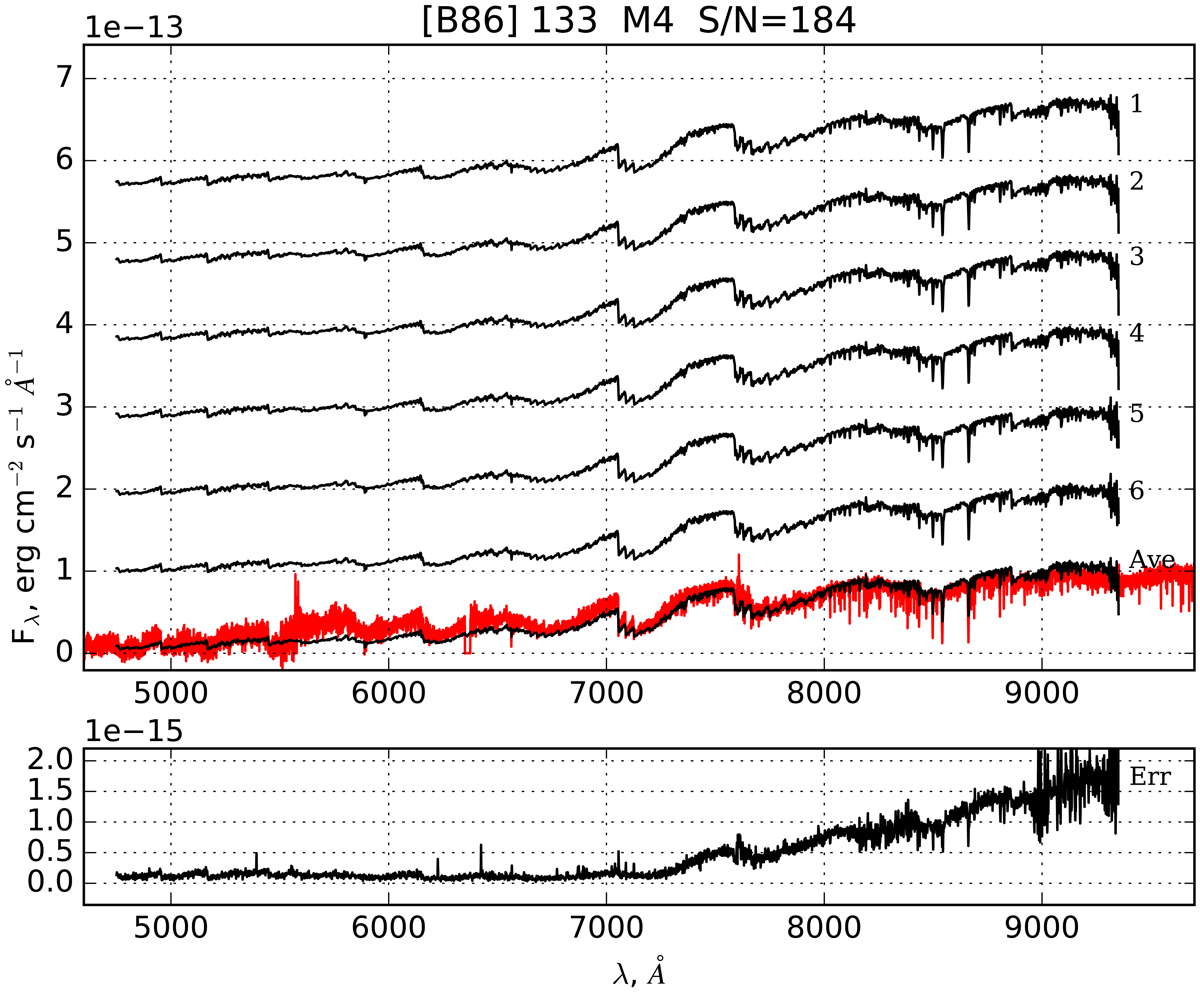
Example of the MUSE spectra (black line) of [B86] 133 and of the corresponding XSL DR1 spectrum (red line; normalized to match the MUSE spectrum flux). The plot title lists the spectral type and the measured median S/N per resolution element over the entire spectrum. Upper sub-panels: spectra extracted from each individual exposure (shifted up for clarity) and average spectra of the object at its true flux level. Bottom sub-panels: standard deviation of the average spectrum. The spectra of the other sample stars are presented in Fig. A.1.
Current usage metrics show cumulative count of Article Views (full-text article views including HTML views, PDF and ePub downloads, according to the available data) and Abstracts Views on Vision4Press platform.
Data correspond to usage on the plateform after 2015. The current usage metrics is available 48-96 hours after online publication and is updated daily on week days.
Initial download of the metrics may take a while.