Fig. 6.
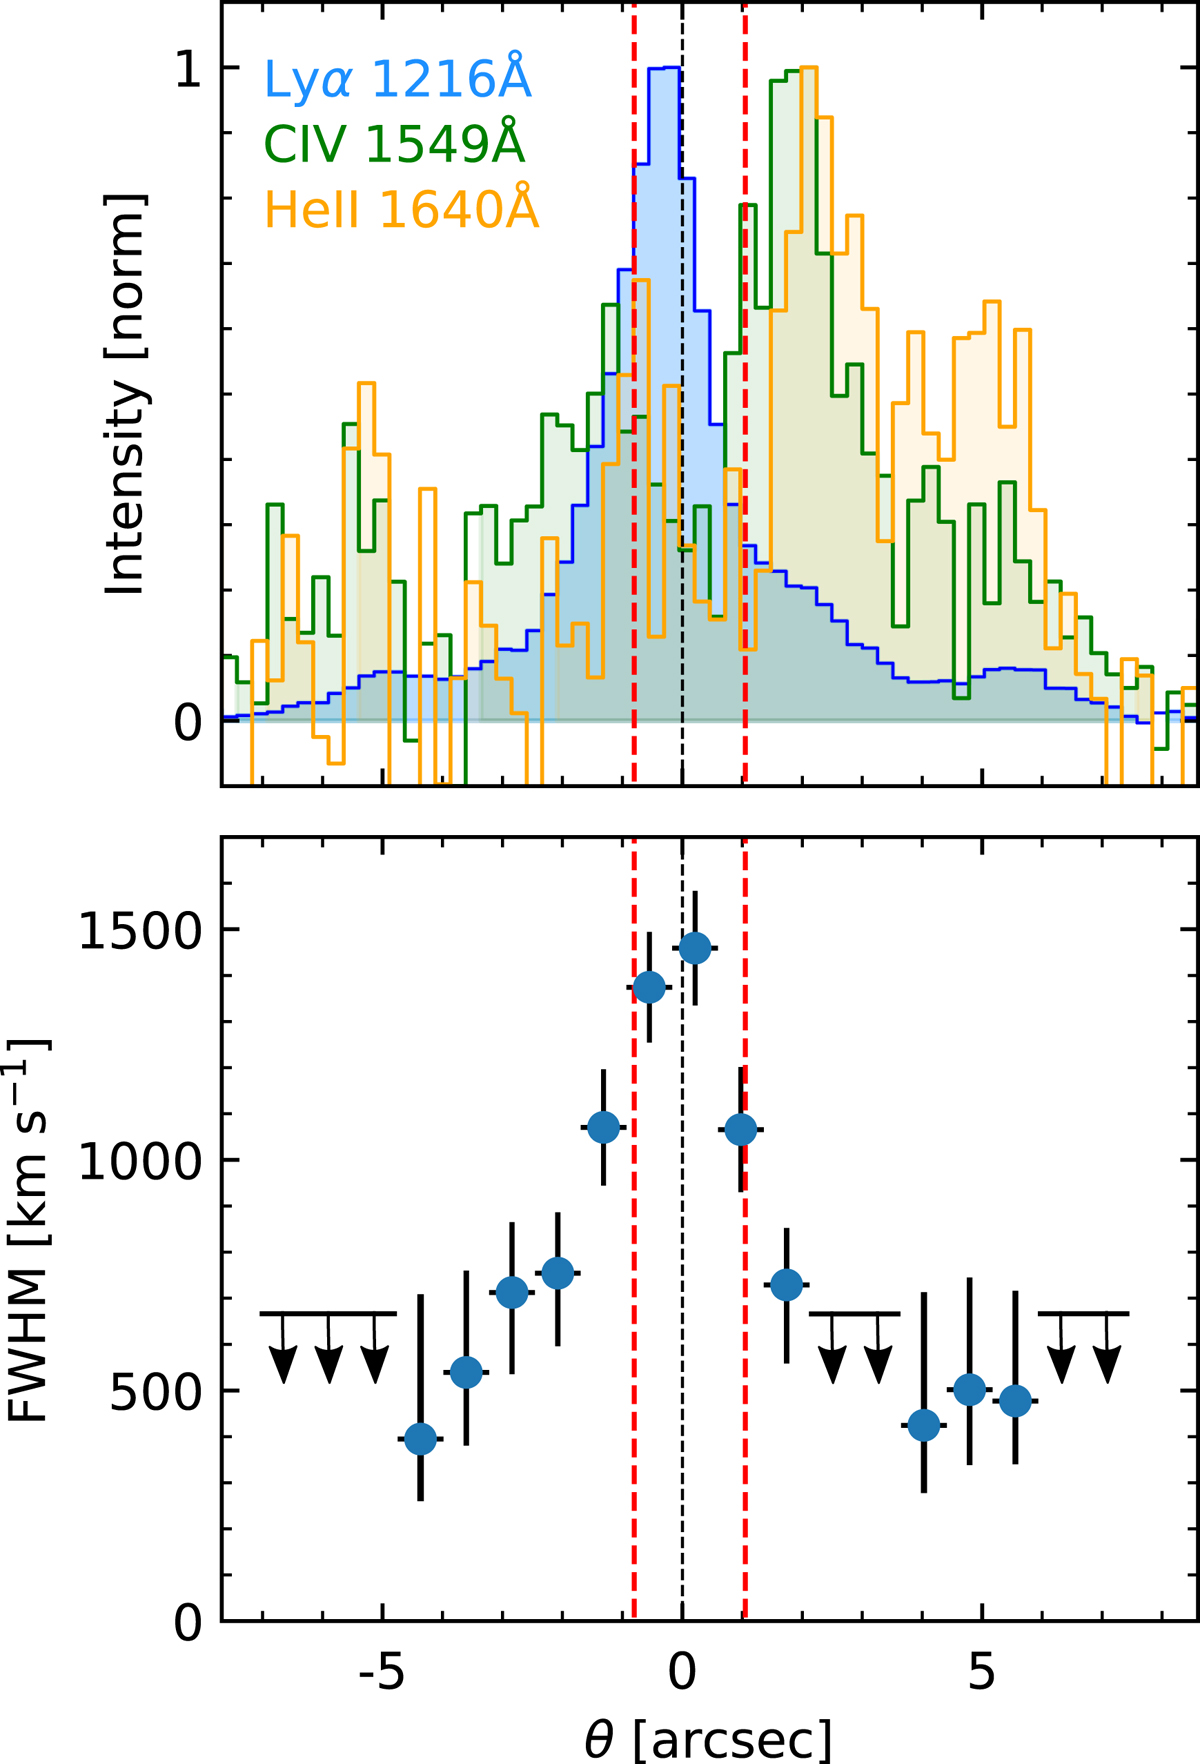
Top: spatial distribution of the normalized flux along the slit of Lyα (blue), C IV (green), and He II (orange). Negative and positive values of θ correspond to PA = 110° and 290° (measured north to east), respectively. Continua have been subtracted. Bottom: Lyα spectral FWHM (already corrected from the instrumental broadening). Arrows represent the FWHM upper limits (≃650 km s−1). The spatial zero marks the location of source A, whereas the approximate positions of VLA radio components are marked with red dashed lines.
Current usage metrics show cumulative count of Article Views (full-text article views including HTML views, PDF and ePub downloads, according to the available data) and Abstracts Views on Vision4Press platform.
Data correspond to usage on the plateform after 2015. The current usage metrics is available 48-96 hours after online publication and is updated daily on week days.
Initial download of the metrics may take a while.