Fig. 5.
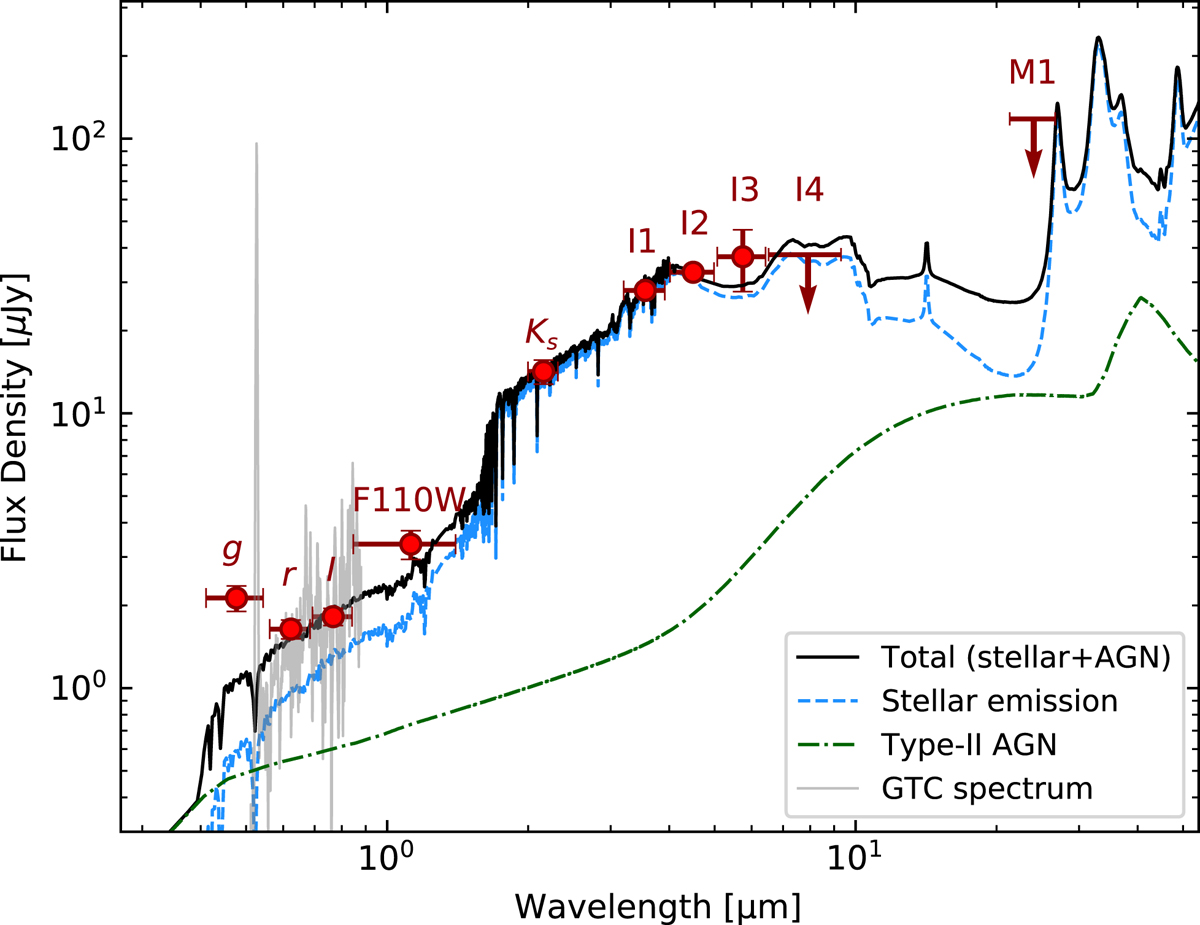
Best-fit model of the SED of source A using SED3FIT (Berta et al. 2013). The black line is the total fitted emission, whereas blue and green lines represent the contribution of stellar and AGN emission, respectively. The fit uses photometry from CFHT r to IRAC 5.8 μm, and the nondetection in the Spitzer IRAC 8.0 μm and MIPS 24 μm bands (in red). We also show the GTC spectrum of source A (in gray, smoothed for visual purpose). We note the flux excess in the g-band (not included in the fit) due to the strong Lyα emission.
Current usage metrics show cumulative count of Article Views (full-text article views including HTML views, PDF and ePub downloads, according to the available data) and Abstracts Views on Vision4Press platform.
Data correspond to usage on the plateform after 2015. The current usage metrics is available 48-96 hours after online publication and is updated daily on week days.
Initial download of the metrics may take a while.