Fig. 4.
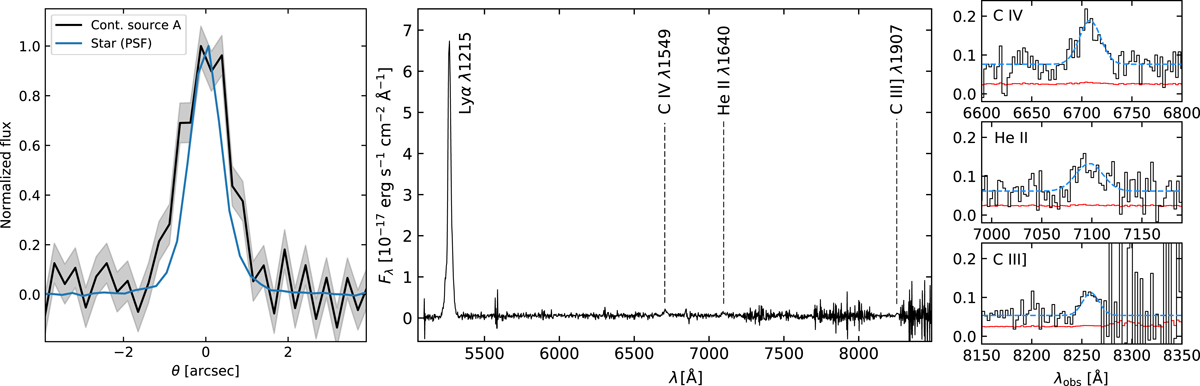
Left: normalized 1D spatial profile (along the slit) of the UV continuum of source A (black solid line and 1σ uncertainty in gray). The PSF profile measured using the reference star at ∼40″ SE of HLock01-LAB is also shown in blue. The UV continuum of source A is compact, but slightly resolved in our spectrum, as well as in the Subaru image and in the high spatial resolution HST image. Middle: OSIRIS/GTC 1D spectrum of source A. The spectrum is characterized by a strong emission in the Lyα line and a very faint continuum (barely detected). Emission in the C IV, He II, and C III] lines is also present, but this appears much fainter (marked with vertical dashed lines). N V 1238,1242 Å is not detected within a 3σ limit of 2.2 × 10⁻¹⁷ erg s−1 cm−2. Right panels: Gaussian fits (blue dashed lines) to the spectral profiles of C IV, He II, and C III] (1σ errors in red).
Current usage metrics show cumulative count of Article Views (full-text article views including HTML views, PDF and ePub downloads, according to the available data) and Abstracts Views on Vision4Press platform.
Data correspond to usage on the plateform after 2015. The current usage metrics is available 48-96 hours after online publication and is updated daily on week days.
Initial download of the metrics may take a while.