Fig. 3.
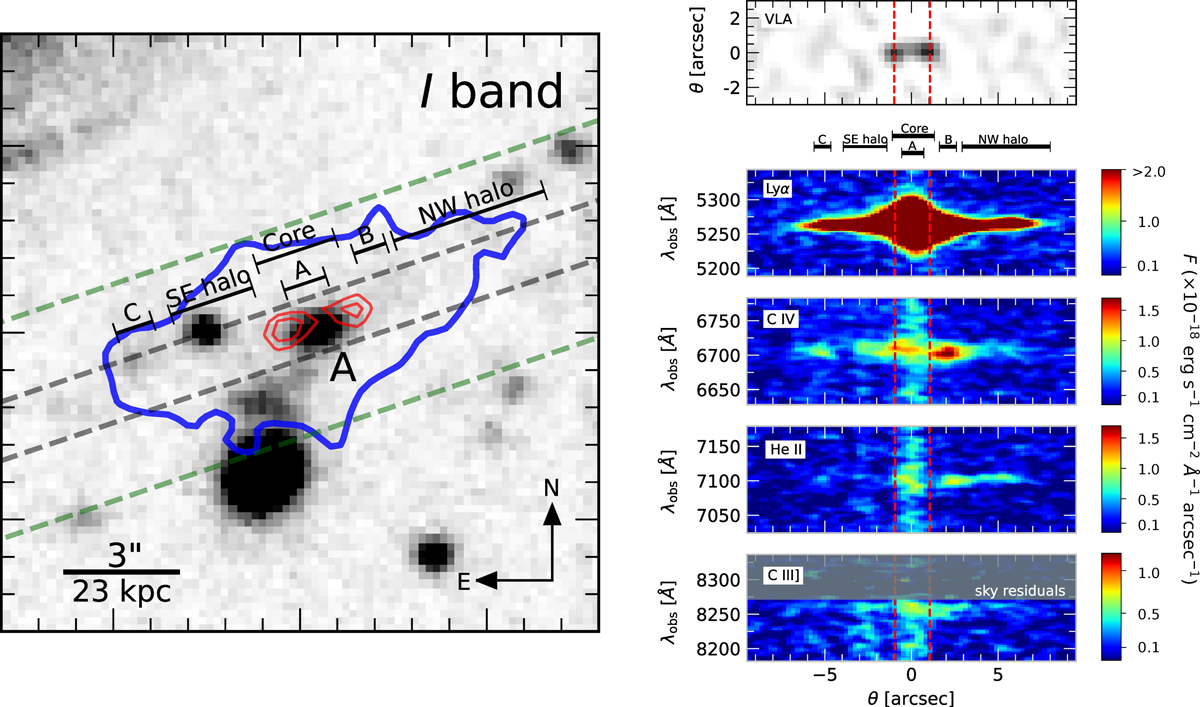
Left: Subaru I band image (16″ × 16″). Blue and red contours represent the 3σ detection of the Lyα emission and the VLA 1.4 GHz radio emission (3 and 4σ levels), respectively. The central galaxy likely responsible for the Lyα and radio emission is labeled as source A. The orientations of the GTC 1.5″- and 5.0″-wide long slits are also plotted with gray and green dashed lines, respectively. The approximate location and size of several apertures used to study the emission line spectra of the central source A, the region encompassing the radio emission (core), knots B and C, and the NW and SE extended regions of the nebula are also shown (see text). Right: VLA 1.4 GHz image (up) and smoothed 2D spectra (down) of Lyα, C IV, He II, and C III] as indicated (using the 1.5″-wide long-slit spectra; flux in units of 10−18 erg s−1 cm−2 Å−1 arcsec−1, considering a pixel size of 2.55 Å and 0.25″ in the spectral and spatial dimensions, respectively). Vertical dashed red lines mark the approximate position along the slit of the radio emission. Lyα is detected over ≃15″, which at z = 3.3 corresponds to ≃110 kpc.
Current usage metrics show cumulative count of Article Views (full-text article views including HTML views, PDF and ePub downloads, according to the available data) and Abstracts Views on Vision4Press platform.
Data correspond to usage on the plateform after 2015. The current usage metrics is available 48-96 hours after online publication and is updated daily on week days.
Initial download of the metrics may take a while.