Fig. 8.
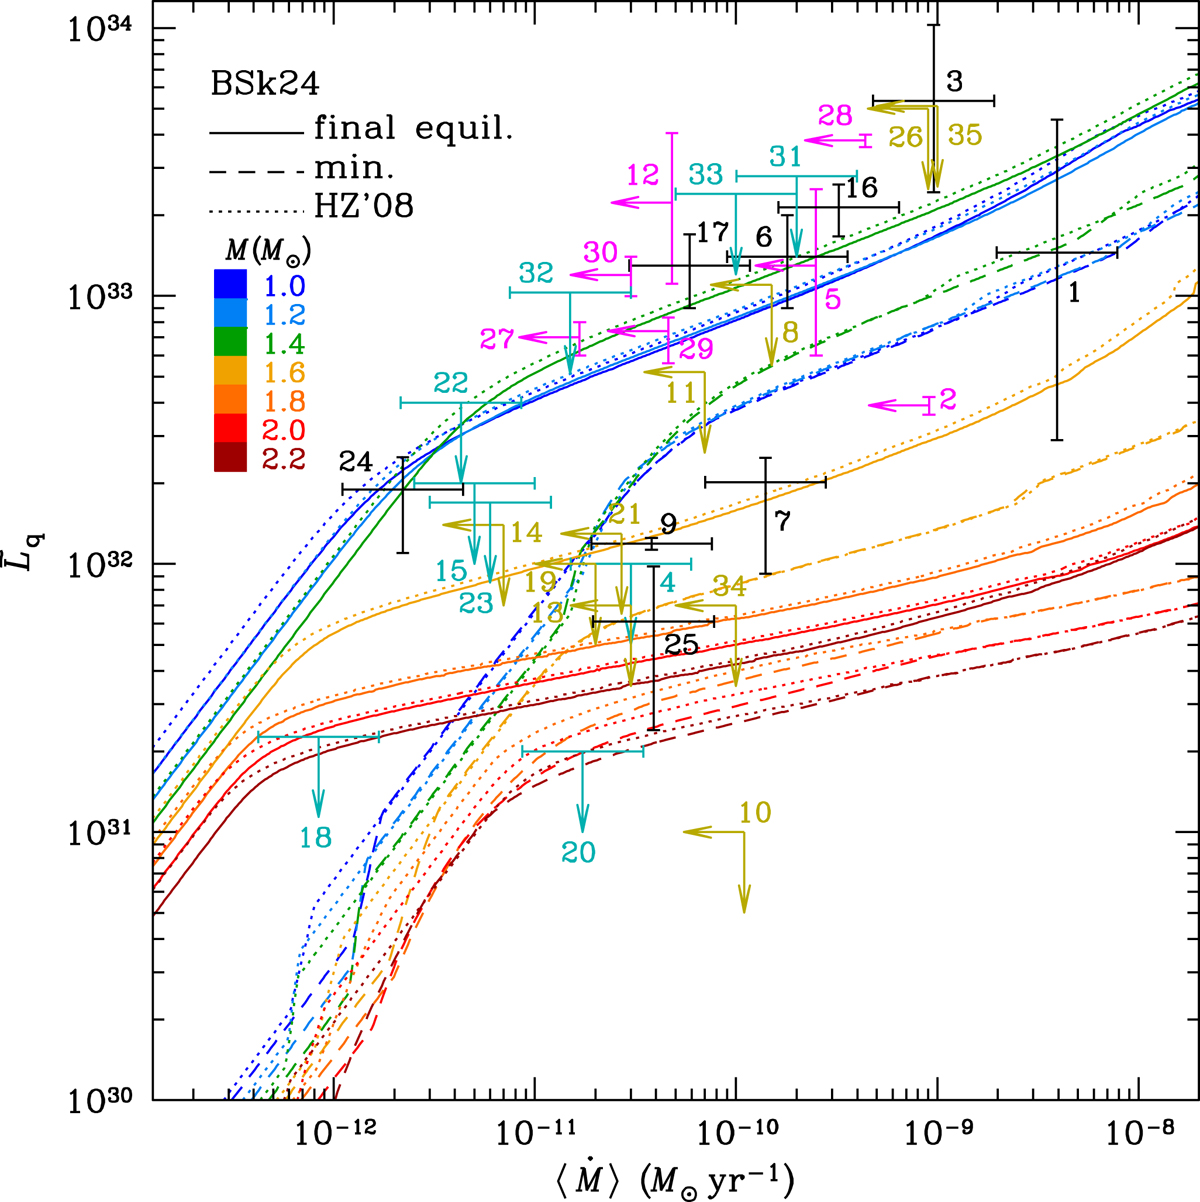
Quasi-equilibrium redshifted luminosity as a function of the average mass accretion rate ⟨Ṁ⟩ for different neutron star masses (coded with color) in the basic neutron-star model. Solid lines show the maximum luminosity ![]() for the FZCPHG model of deep crustal heating, dashed lines show the minimum
for the FZCPHG model of deep crustal heating, dashed lines show the minimum ![]() for the same model, and dotted lines display the results for the HZ’08 accreted crust heating model (both maximum and minimum).
for the same model, and dotted lines display the results for the HZ’08 accreted crust heating model (both maximum and minimum).
Current usage metrics show cumulative count of Article Views (full-text article views including HTML views, PDF and ePub downloads, according to the available data) and Abstracts Views on Vision4Press platform.
Data correspond to usage on the plateform after 2015. The current usage metrics is available 48-96 hours after online publication and is updated daily on week days.
Initial download of the metrics may take a while.