Fig. 4.
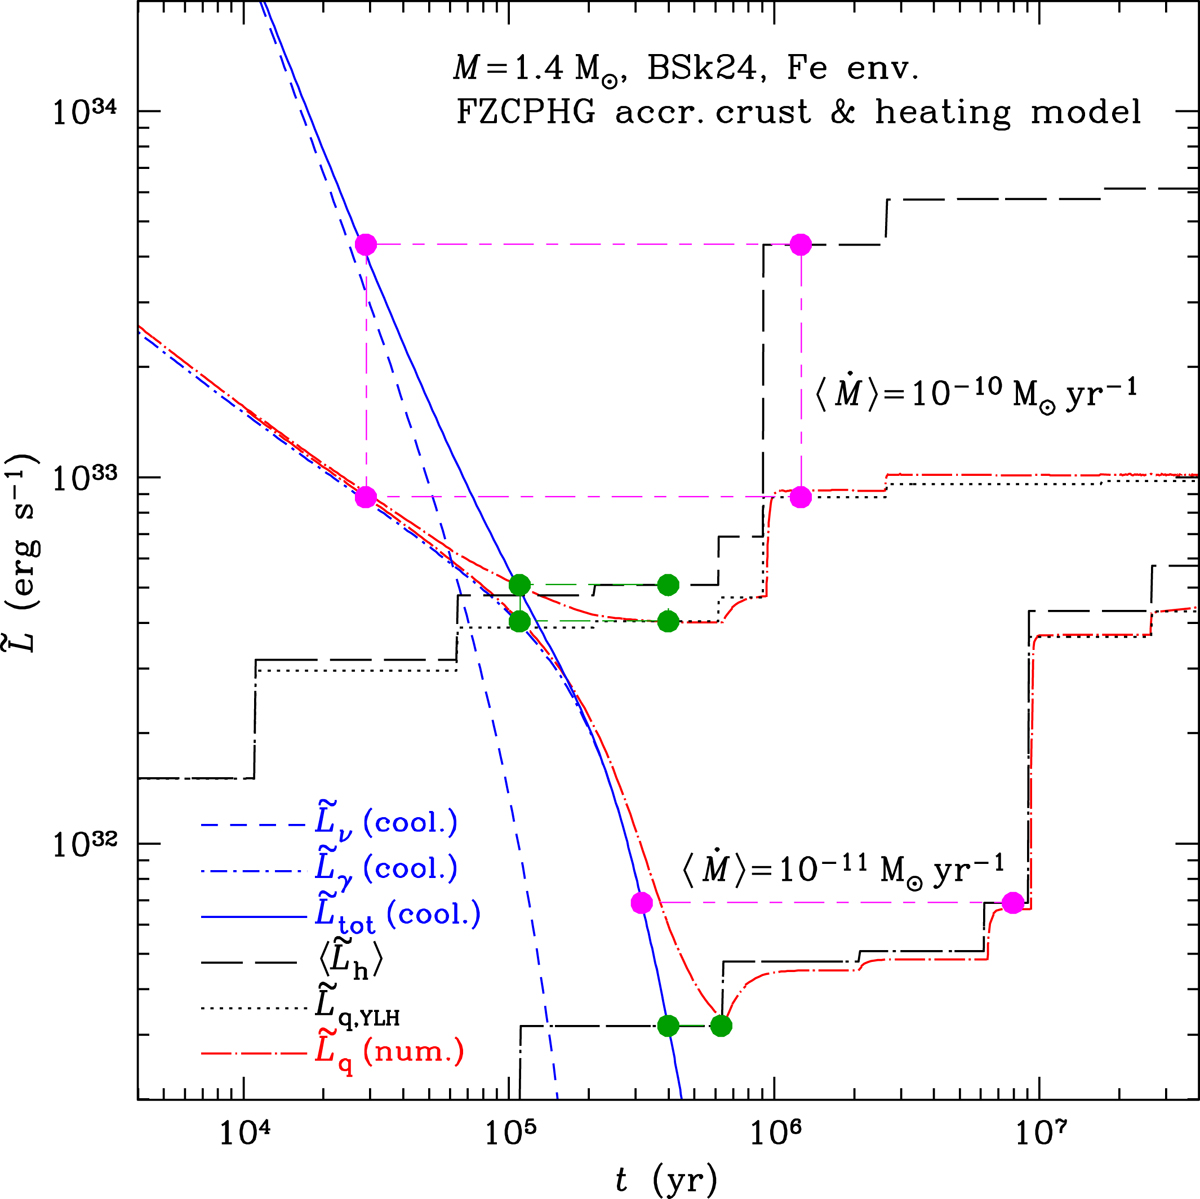
Illustration of the approximate calculation of the quasi-equilibrium quiescent luminosity according to the YLH method for a neutron star with mass M = 1.4 M⊙, described by the BSk24 EoS and composition model in the nonaccreted crust and the core and by the FZCPHG model of composition and heat sources in the accreted crust, with an iron heat-blanketing envelope. The blue solid line shows the total energy loss rate ![]() , which is the sum of the neutrino luminosity Lν (blue short-dashed line) and the photon luminosity Lγ (blue dot-short-dash line), of a cooling INS as function of the cooling time t. The black long-dashed stepped lines show the average power
, which is the sum of the neutrino luminosity Lν (blue short-dashed line) and the photon luminosity Lγ (blue dot-short-dash line), of a cooling INS as function of the cooling time t. The black long-dashed stepped lines show the average power ![]() as function of the accretion time t, assuming a constant average accretion rate ⟨Ṁ⟩ = 10−10 M⊙ yr−1 (the upper line) or ⟨Ṁ⟩ = 10−11 M⊙yr−1 (the lower line). The dotted stepped lines show the photon luminosities
as function of the accretion time t, assuming a constant average accretion rate ⟨Ṁ⟩ = 10−10 M⊙ yr−1 (the upper line) or ⟨Ṁ⟩ = 10−11 M⊙yr−1 (the lower line). The dotted stepped lines show the photon luminosities ![]() , as functions of the accretion time, which correspond to the cooling time moments when
, as functions of the accretion time, which correspond to the cooling time moments when ![]() . The thin long-dash–short-dash lines serve as guides to the eye: they connect the corresponding total and photon luminosities and the corresponding cooling and heating time values. The red dot-long-dashed lines show the evolution of the bolometric photon luminosity in the numerical model of a cooling and heating neutron star, assuming that the accretion starts sufficiently soon after the start of the cooling and proceeds at a rate either 10−10 M⊙ yr−1 (the upper curve) or 10−11 M⊙ yr−1 (the lower line). All plotted luminosities are redshifted as measured in a remote frame of reference.
. The thin long-dash–short-dash lines serve as guides to the eye: they connect the corresponding total and photon luminosities and the corresponding cooling and heating time values. The red dot-long-dashed lines show the evolution of the bolometric photon luminosity in the numerical model of a cooling and heating neutron star, assuming that the accretion starts sufficiently soon after the start of the cooling and proceeds at a rate either 10−10 M⊙ yr−1 (the upper curve) or 10−11 M⊙ yr−1 (the lower line). All plotted luminosities are redshifted as measured in a remote frame of reference.
Current usage metrics show cumulative count of Article Views (full-text article views including HTML views, PDF and ePub downloads, according to the available data) and Abstracts Views on Vision4Press platform.
Data correspond to usage on the plateform after 2015. The current usage metrics is available 48-96 hours after online publication and is updated daily on week days.
Initial download of the metrics may take a while.