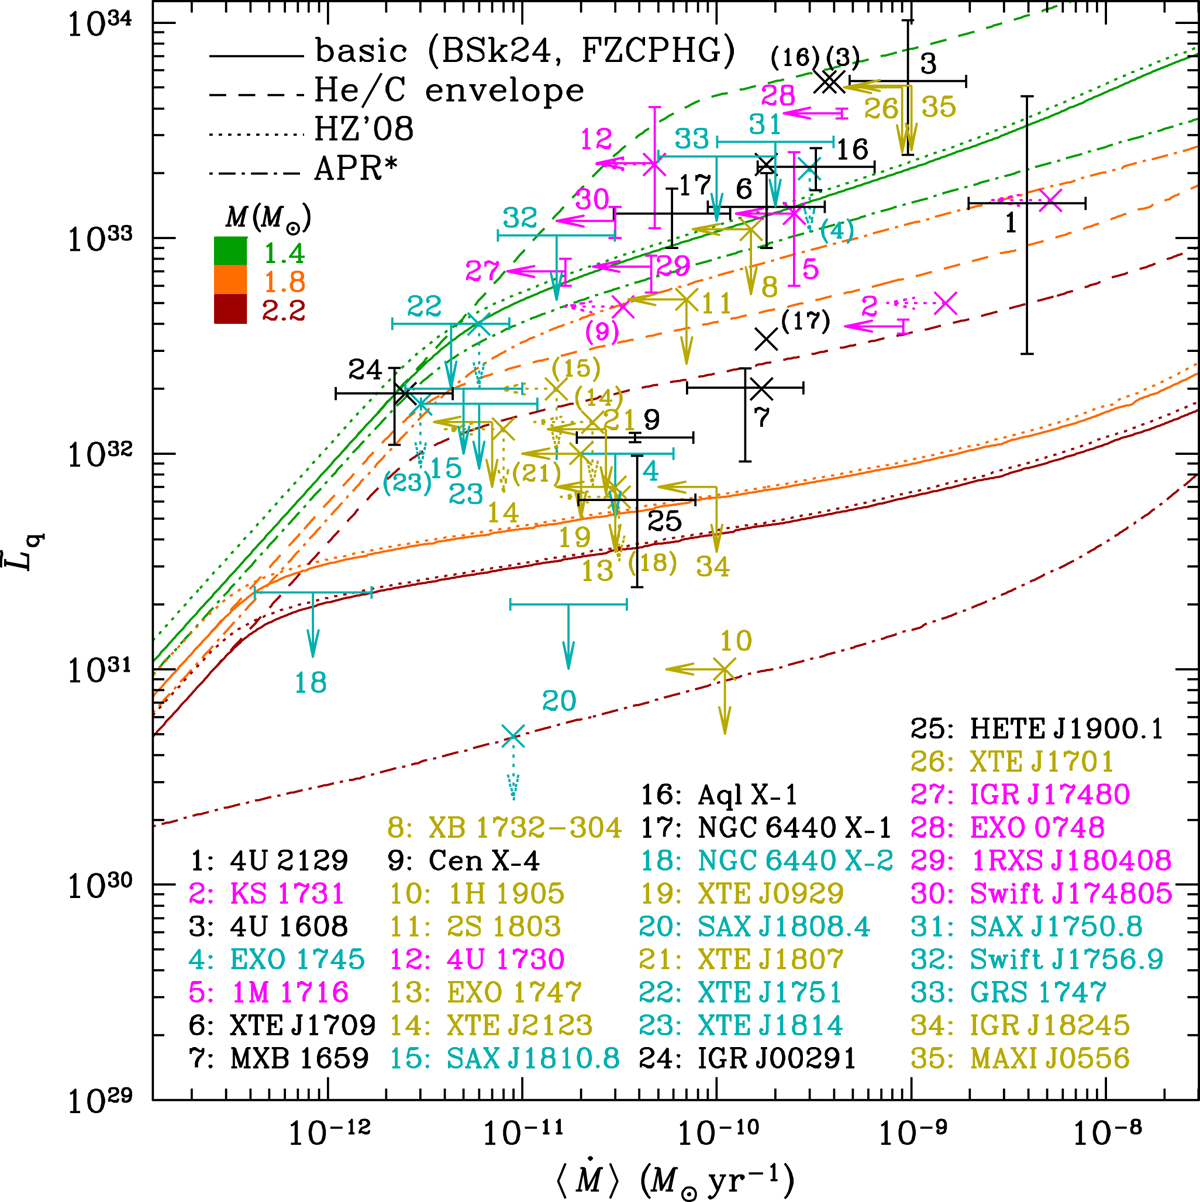
Fig. 3.

Quiescent thermal luminosities of SXTs as functions of average accretion rates. Solid errorbars and arrows show the data listed in Table 2. Crosses without errorbars and dotted arrows show the older estimates and upper limits (e.g., Table 2 of Beznogov & Yakovlev 2015a). The solid errorbars (arrows) are labeled by numbers from the first column of Tables 1 and 2, and abbreviated names of associated objects are listed in the lower part of the figure. In some cases, to avoid confusion, the crosses or dotted arrows are also labeled by the numbers in parentheses. The lines show theoretical predictions for the thermal quasi-equilibrium luminosity as a function of time-averaged accretion rate due to the heating of a fully accreted crust of neutron stars of three masses, M = 1.4 M⊙, 1.8 M⊙, and 2.2 M⊙ (from upper to lower lines of the same type, coded by color), computed using the method described in Sect. 3.2 for different theoretical models described in Sect. 2: the “basic model” (solid lines), the same model with a fully accreted heat-blanketing envelope (dashed lines), the basic model with HZ’08 heating and composition of the crust instead of FZCPHG (the dotted lines), and the alternative model (APR* EoS and composition, BBST effective baryon masses) with iron thermal-insulating envelope (dot-dashed lines).
Current usage metrics show cumulative count of Article Views (full-text article views including HTML views, PDF and ePub downloads, according to the available data) and Abstracts Views on Vision4Press platform.
Data correspond to usage on the plateform after 2015. The current usage metrics is available 48-96 hours after online publication and is updated daily on week days.
Initial download of the metrics may take a while.


