Fig. 8.
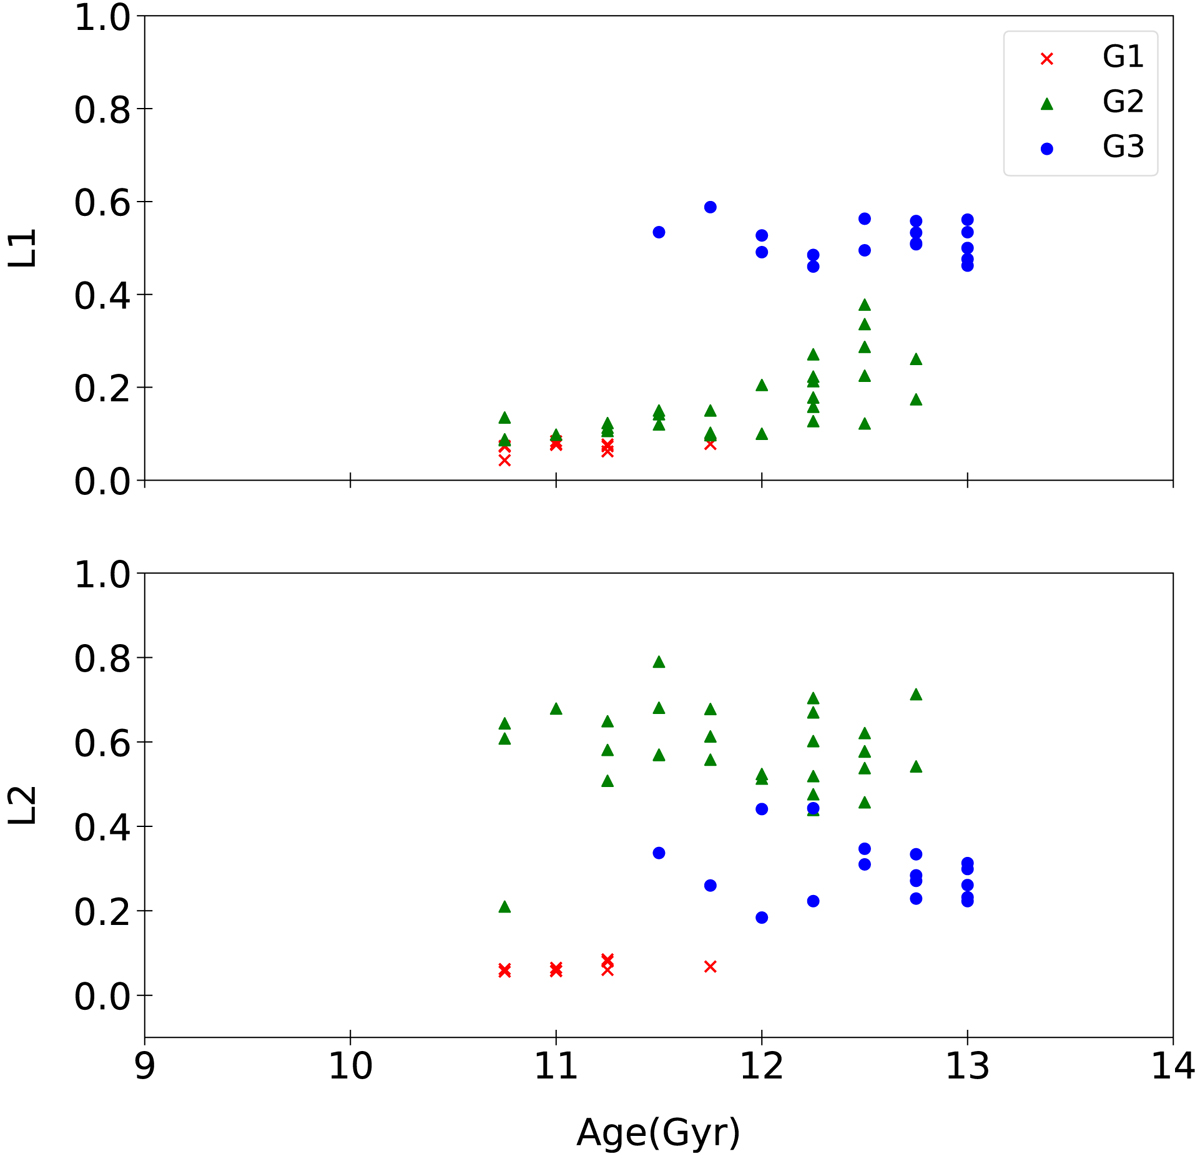
L1 and L2 indices as a function of the cluster age (Gyr) from VandenBerg et al. (2013), Leaman et al. (2013). The different symbols and colours identify the different cluster groups defined in Milone et al. (2014): G1 (red crosses) for metal-rich globulars ([Fe/H] > −1.0), G2 (green triangles) for clusters with [Fe/H] < −1.0 and L1 ≤ 0.4, G3 (blue circles) for globulars with L1 ≥ 0.4.
Current usage metrics show cumulative count of Article Views (full-text article views including HTML views, PDF and ePub downloads, according to the available data) and Abstracts Views on Vision4Press platform.
Data correspond to usage on the plateform after 2015. The current usage metrics is available 48-96 hours after online publication and is updated daily on week days.
Initial download of the metrics may take a while.