Fig. 18.
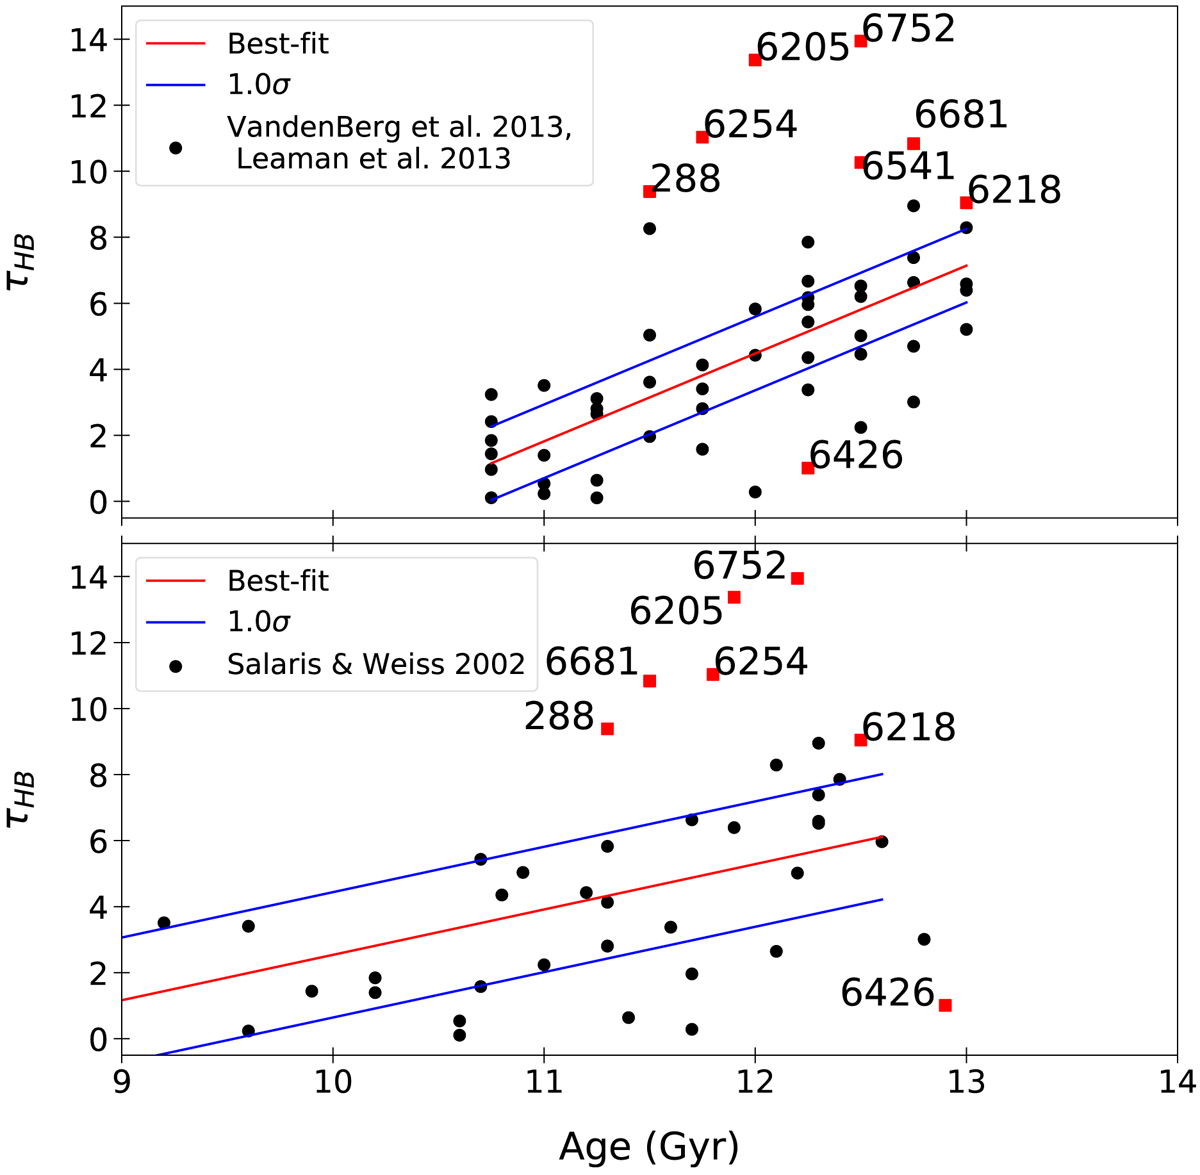
Our index τHB as a function of cluster ages obtained from different authors. Top: cluster ages from VandenBerg et al. (2013), Leaman et al. (2013). The error bar in the lower left corner shows the conservative ±0.5 Gyr error on the GGC ages. Bottom: ages from Salaris & Weiss (2002) based on the metallicity scale provided by Carretta & Gratton (1997). In both panels red squares are the same second parameter clusters shown in Fig. 16 and discussed in this section. Red lines determine the best-fit to each data sample, blue lines the ±1σ levels.
Current usage metrics show cumulative count of Article Views (full-text article views including HTML views, PDF and ePub downloads, according to the available data) and Abstracts Views on Vision4Press platform.
Data correspond to usage on the plateform after 2015. The current usage metrics is available 48-96 hours after online publication and is updated daily on week days.
Initial download of the metrics may take a while.