Fig. 16.
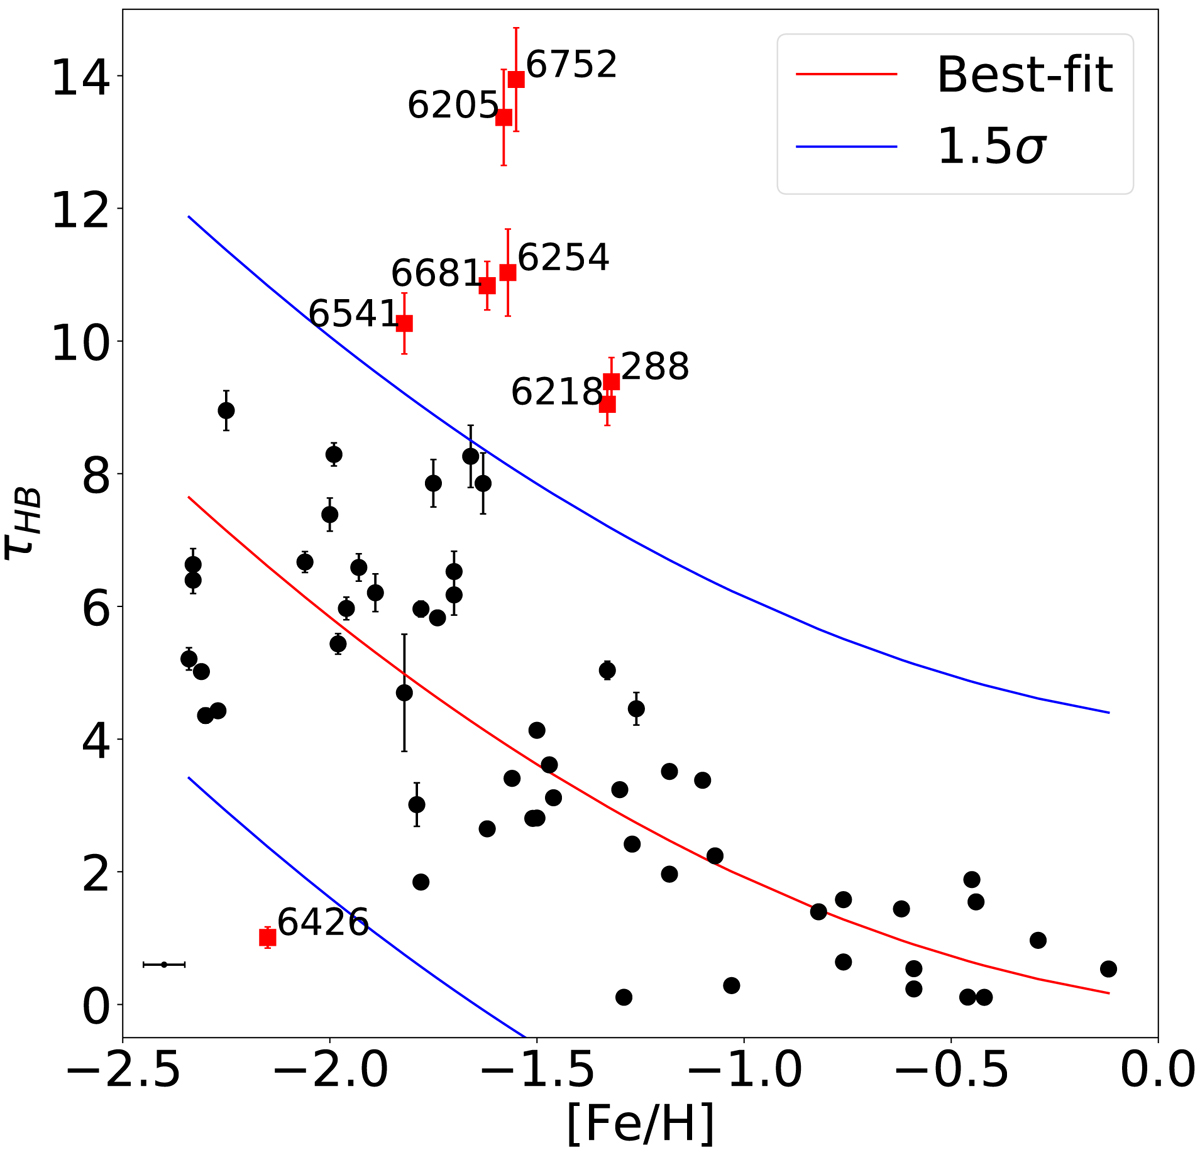
Variation of τHB as a function of cluster metallicity (Carretta et al. 2009). The red line shows the quadratic best fit, the blue lines show 1.5σ levels. Red squares display the outliers, which are those objects located at more than 1.5σ from the quadratic fit. In the left corner the error bar shows the 0.1 dex error on the metal content.
Current usage metrics show cumulative count of Article Views (full-text article views including HTML views, PDF and ePub downloads, according to the available data) and Abstracts Views on Vision4Press platform.
Data correspond to usage on the plateform after 2015. The current usage metrics is available 48-96 hours after online publication and is updated daily on week days.
Initial download of the metrics may take a while.