Fig. 9.
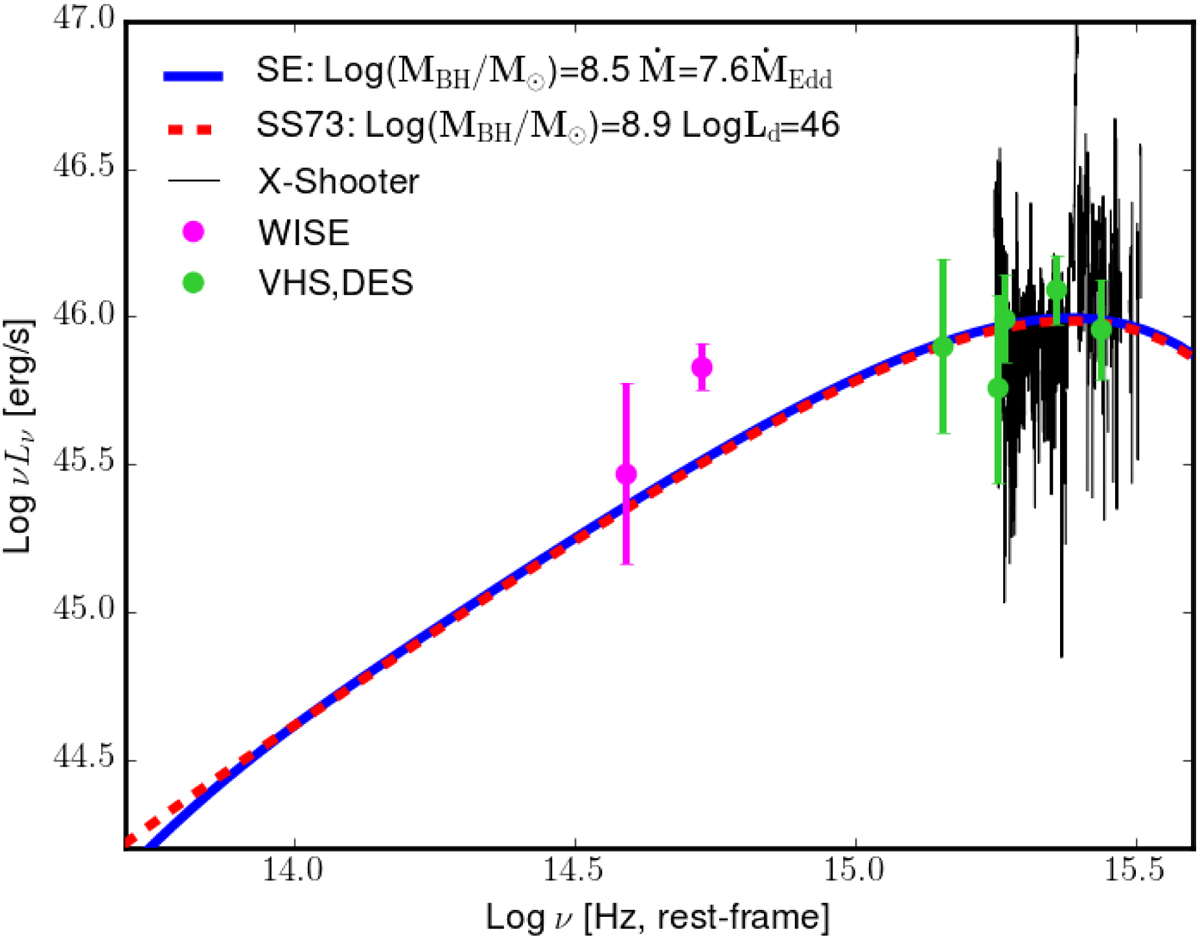
Accretion disk models of optical spectrum and optical-IR photometric data of DES0141−54. Dashed red line represents the best modeling of SS73, instead the blue line represents the best model from an SE model. We corrected the spectrum and the photometric points for absorption due to intervening HI clouds using the model described in Meiksin (2006).
Current usage metrics show cumulative count of Article Views (full-text article views including HTML views, PDF and ePub downloads, according to the available data) and Abstracts Views on Vision4Press platform.
Data correspond to usage on the plateform after 2015. The current usage metrics is available 48-96 hours after online publication and is updated daily on week days.
Initial download of the metrics may take a while.