Fig. 4.
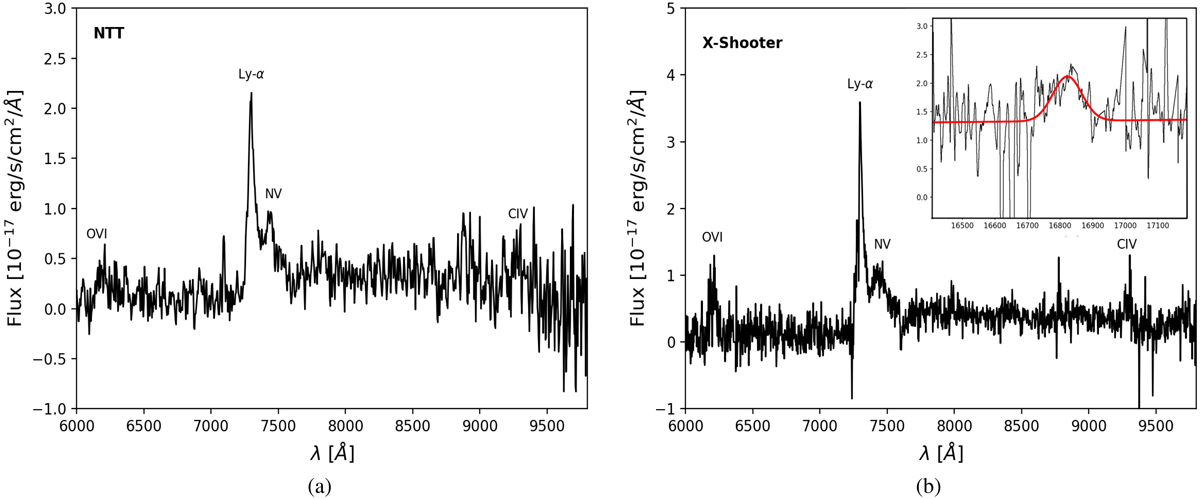
Optical spectra of DES0141−54. Left panel: EFOSC2/NTT discovery spectrum; right panel: X-shooter/VLT follow-up. In the small inset on the right the zoomed-in portion of the IR spectrum with the Gaussian fit of the Mg IIλ2798 Å line. In both panels the Ly-αλ1216 Å, the NV λ1242.80 Å, the CIV λ1549 Å and the O[VI]λ1035 Å emission lines are shown.
Current usage metrics show cumulative count of Article Views (full-text article views including HTML views, PDF and ePub downloads, according to the available data) and Abstracts Views on Vision4Press platform.
Data correspond to usage on the plateform after 2015. The current usage metrics is available 48-96 hours after online publication and is updated daily on week days.
Initial download of the metrics may take a while.