Fig. 10.
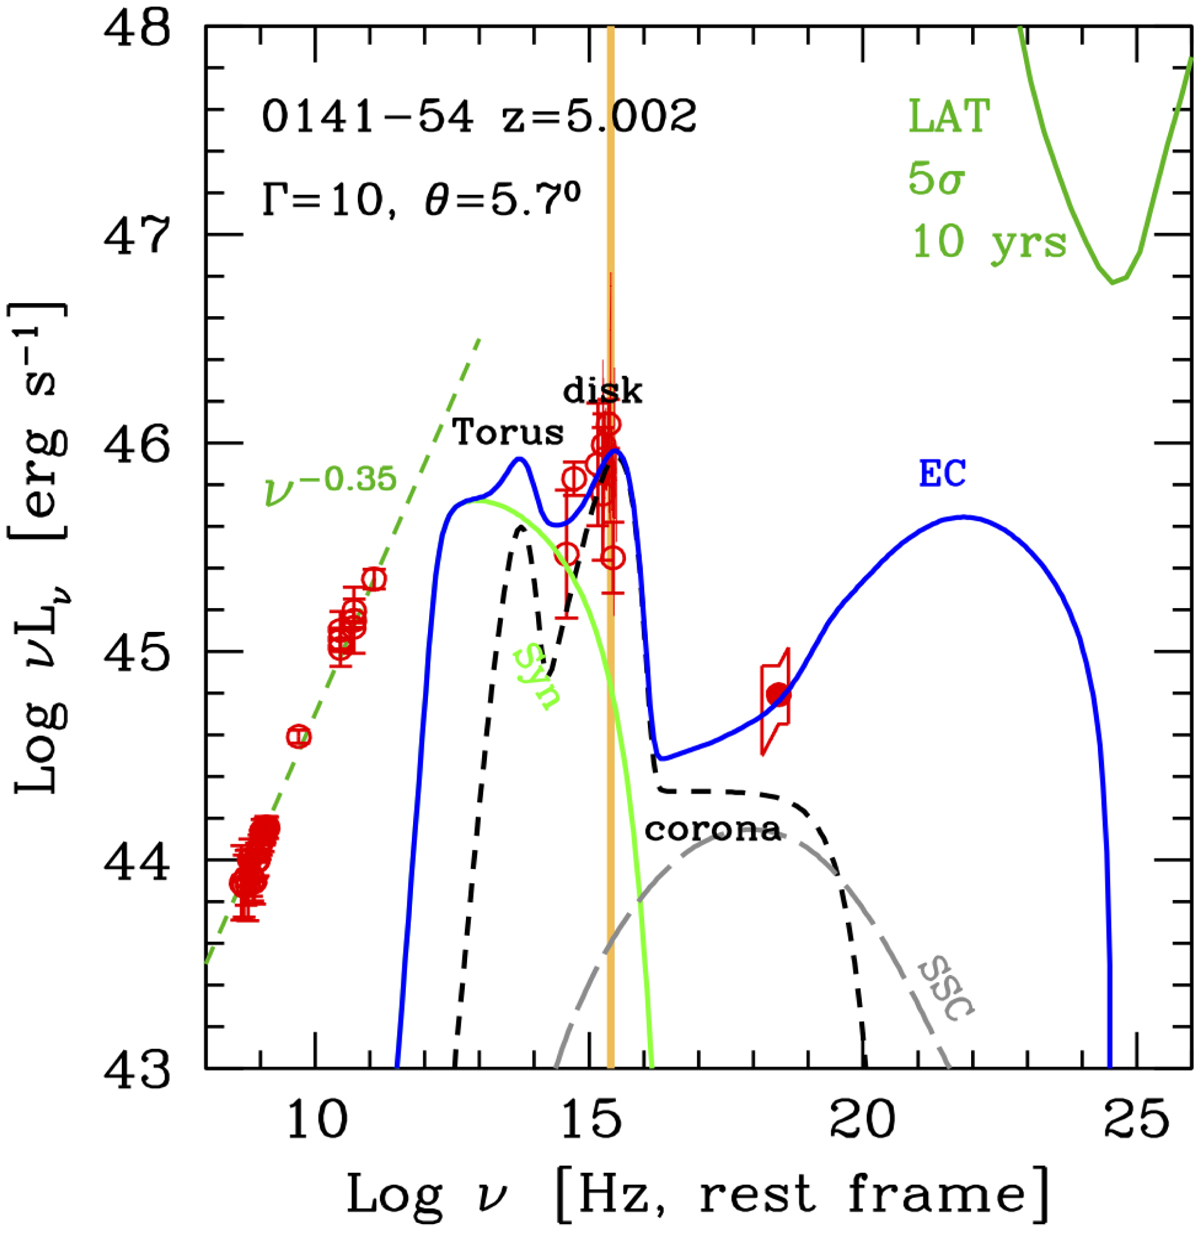
SED of DES0141−54 from the radio to X-ray frequencies: the solid blue line shows the theoretical blazar model; the dashed black line is the spectrum of an accretion disk, together with the IR torus radiation and the X-ray emission produced in the hot corona; the solid light green line refers to the synchrotron emission; the grey long dashed line is the SSC component. The vertical orange line marks the position of the Ly-α break. As described in Ghisellini & Tavecchio (2009) the model does not reproduce the radio part of the SED because the jet emitting region that interacts with the external photons is compact and therefore auto-absorbed at low frequencies. We also report in green the Fermi/LAT sensitivity curve after 10 years (at 5σ) that shows that our predictions are consistent with a non detection by Fermi.
Current usage metrics show cumulative count of Article Views (full-text article views including HTML views, PDF and ePub downloads, according to the available data) and Abstracts Views on Vision4Press platform.
Data correspond to usage on the plateform after 2015. The current usage metrics is available 48-96 hours after online publication and is updated daily on week days.
Initial download of the metrics may take a while.