Fig. 5
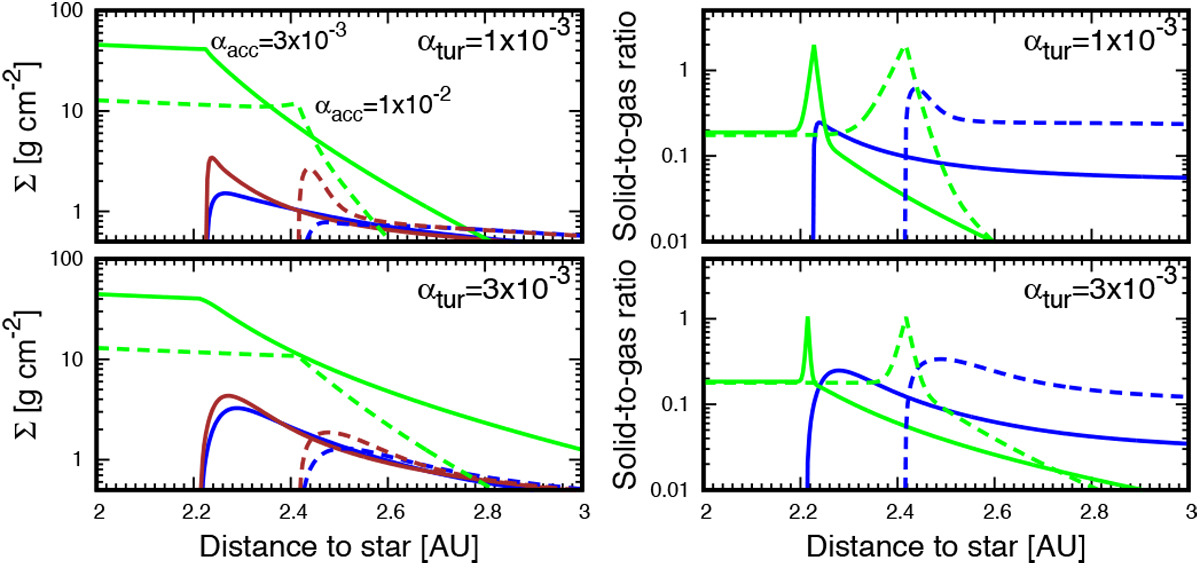
Surface density (left) and midplane solid-to-gas ratio (right) for the case of Fp/g = 0.3, Ṁgas = 10−8Msun yr−1 and K = 0. Top panels: cases of the turbulent viscosity of αtur = 1 × 10⁻³. Bottom panels: case of αtur = 3 × 10⁻³. In each panel, solid and dashed lines represent the cases of the effective viscosity of αacc = 3 × 10⁻³ and αacc = 1 × 10⁻², respectively. In the left panel, blue, brown and green lines represent those of ice in pebbles, silicate in pebbles and silicate grains, respectively. In the right panel, blue and green lines represent those of pebbles and silicate grains, respectively.
Current usage metrics show cumulative count of Article Views (full-text article views including HTML views, PDF and ePub downloads, according to the available data) and Abstracts Views on Vision4Press platform.
Data correspond to usage on the plateform after 2015. The current usage metrics is available 48-96 hours after online publication and is updated daily on week days.
Initial download of the metrics may take a while.