Fig. 4
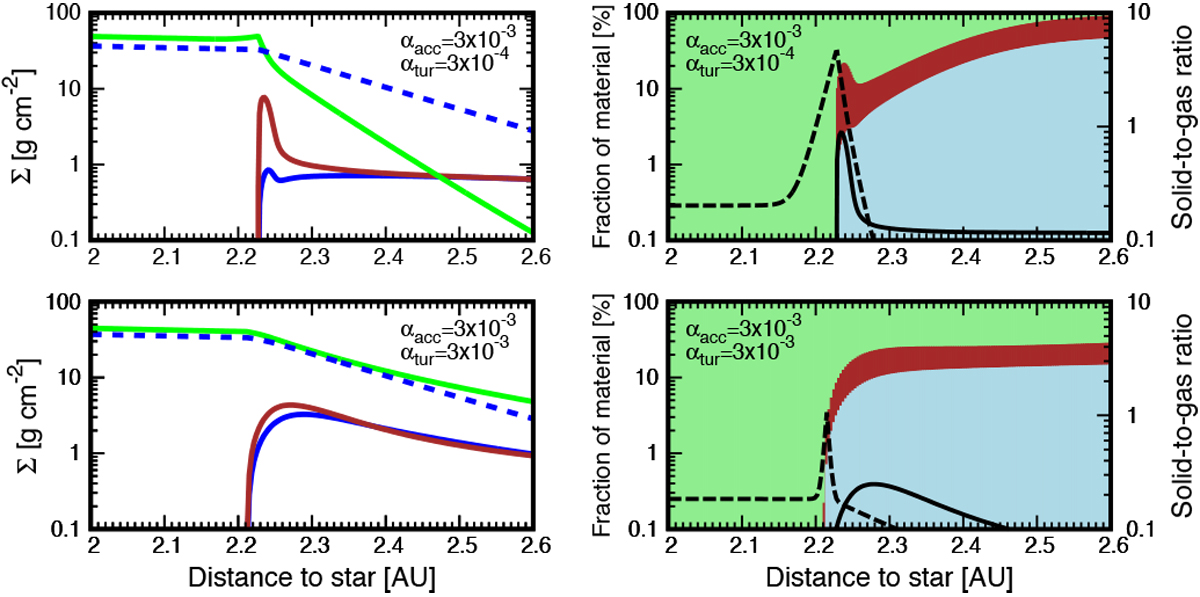
Surface density profile (left) and fraction of different materials (right) in two cases of turbulent strength, αtur = 3 × 10⁻⁴ (top) and αtur = 3 × 10⁻³ (bottom) with αacc = 3 × 10⁻³ and Fp/g = 0.3 (K = 0). Left panels: green, brown and blue solid lines represent surface densities of silicate grains, silicate in a pebble and ice in a pebble, respectively. Blue dashed lines in the left panels represent vapor surface density. Right panels: green, brown and cyan colors represent a fraction of silicate grains, silicate in a pebble and ice in a pebble, respectively. In the right panel, dashed and solid lines represent the solid-to-gas ratio of silicate grains and pebbles, respectively.
Current usage metrics show cumulative count of Article Views (full-text article views including HTML views, PDF and ePub downloads, according to the available data) and Abstracts Views on Vision4Press platform.
Data correspond to usage on the plateform after 2015. The current usage metrics is available 48-96 hours after online publication and is updated daily on week days.
Initial download of the metrics may take a while.