Fig. 3
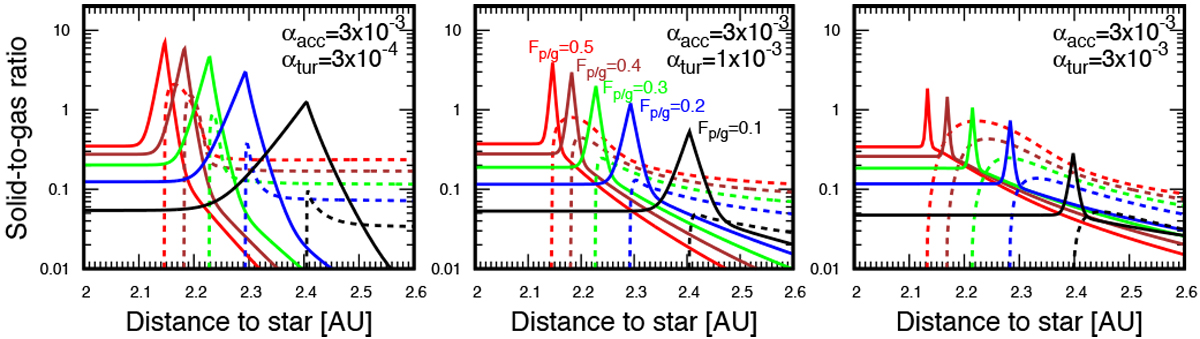
Midplane solid-to-gas ratio of silicate grains (solid lines) and pebbles (dashed lines) at different diffusion strength αtur and pebble flux Fp/g at effective alpha of αacc = 3 × 10⁻³. Left, middle, and right panels: results for αtur = 3 × 10⁻⁴, 10−3 and 3 × 10⁻³, respectively. Red, brown, green, blue and black lines represent cases of Fp/g = 0.5, 0.4, 0.3, 0.2 and 0.1, respectively. Silicate grains have the peaks of their solid-to-gas ratios just inside the snow line. This is because the silicate grains initially have the same scale height with that of pebbles and they gradually diffuse vertically to reach the gas scale height (see Eq. (15)).
Current usage metrics show cumulative count of Article Views (full-text article views including HTML views, PDF and ePub downloads, according to the available data) and Abstracts Views on Vision4Press platform.
Data correspond to usage on the plateform after 2015. The current usage metrics is available 48-96 hours after online publication and is updated daily on week days.
Initial download of the metrics may take a while.