Fig. 2
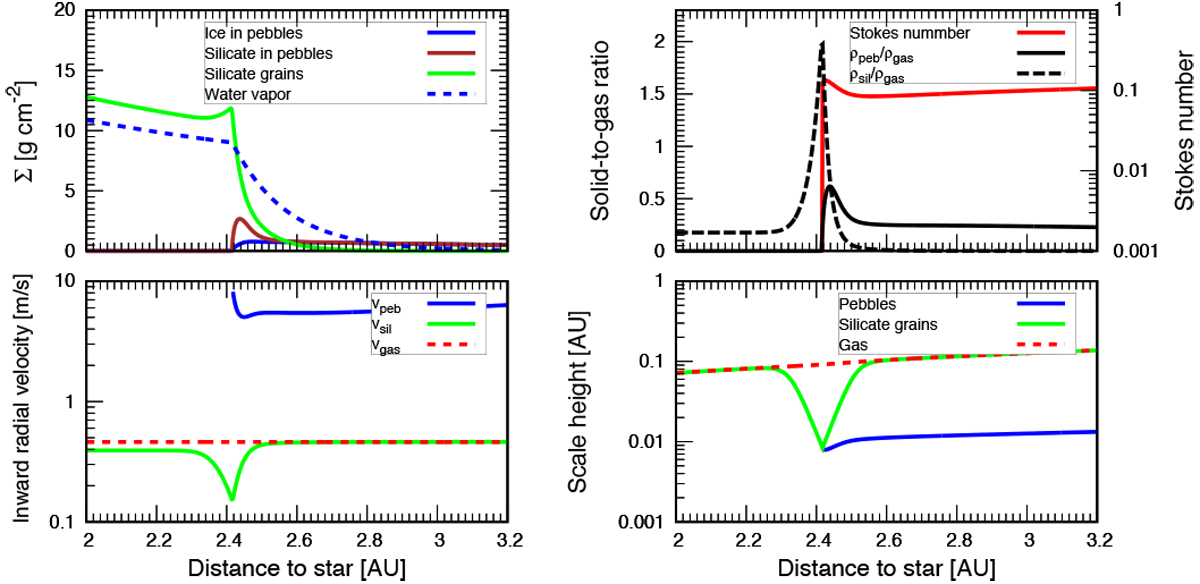
Typical steady state in the case of αacc = 1 × 10⁻², αtur = 1 × 10⁻³, Fp/g = 0.3 and Drift-BKR is included (K = 0). Left top panel: surface densities of solids and vapor. Right top panel: midplane solid-to-gas ratios of pebbles (solid line) and silicate grains (dashed line) as well as the Stokes number of pebbles by red solid line. Left bottom panel: radial velocities of solids and vapor. Right bottom panel: scale heights of solids and vapor. In each panel (except top right panel), blue and brown solid lines represent those of ice and silicate components in pebbles, respectively. Green lines represent those of silicate grains. Red and blue dashed lines represent those of the background gas and water vapor, respectively.
Current usage metrics show cumulative count of Article Views (full-text article views including HTML views, PDF and ePub downloads, according to the available data) and Abstracts Views on Vision4Press platform.
Data correspond to usage on the plateform after 2015. The current usage metrics is available 48-96 hours after online publication and is updated daily on week days.
Initial download of the metrics may take a while.