Fig. 1
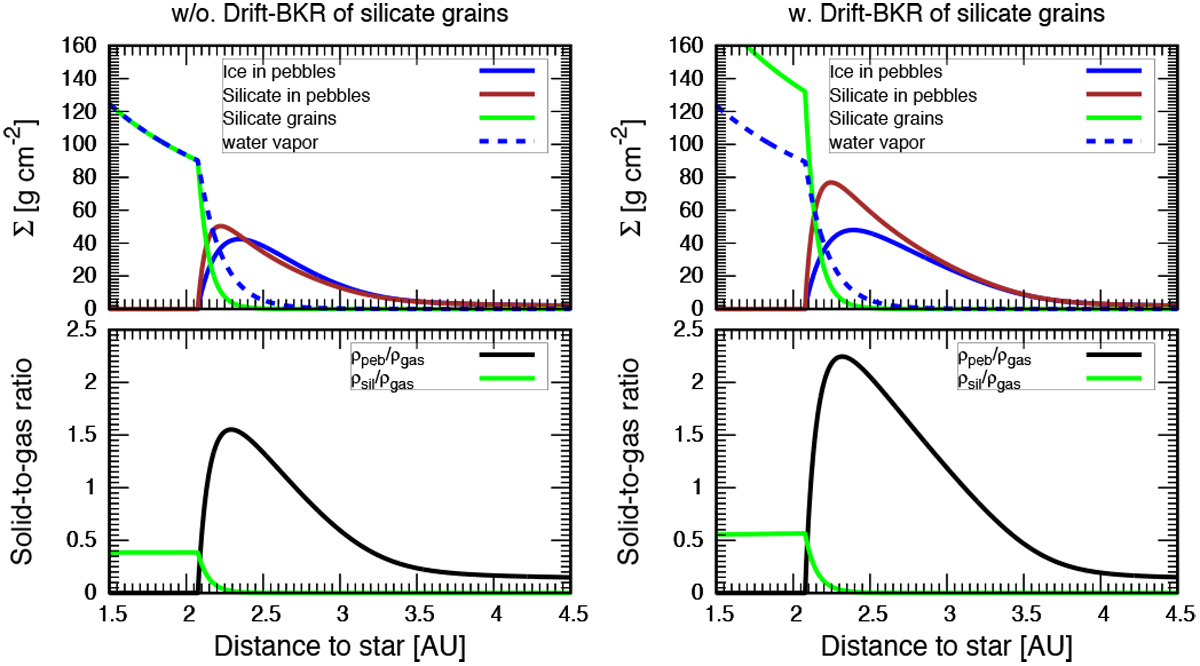
Surface density profile (top) and midplane solid-to-gas density ratio (bottom). Left panels: case where Drift-BKR of only pebbles is considered (the same setting with Schoonenberg & Ormel 2017). Right panels: case where Drift-BKR of both pebbles and the released silicate grains are considered. Top panels: blue, brown and green solid lines represent those of ice in pebbles, silicate in pebbles and silicate grains, respectively. Dashed blue lines in the top panels represent those of water vapor. Bottom panels: black and green lines represent those of pebbles and silicate grains, respectively. Here, we assume that the silicate grains are instantaneously mixed with the background gas and have the same scale height with the gas. We also assume that αacc = αtur = 3 × 10⁻³, St = 0.03 at 3 au and Fp/g = 0.8 for the direct comparison between the left panels and the results of Schoonenberg & Ormel (2017, “many-seeds” model of their Fig. 5).
Current usage metrics show cumulative count of Article Views (full-text article views including HTML views, PDF and ePub downloads, according to the available data) and Abstracts Views on Vision4Press platform.
Data correspond to usage on the plateform after 2015. The current usage metrics is available 48-96 hours after online publication and is updated daily on week days.
Initial download of the metrics may take a while.