Fig. 7.
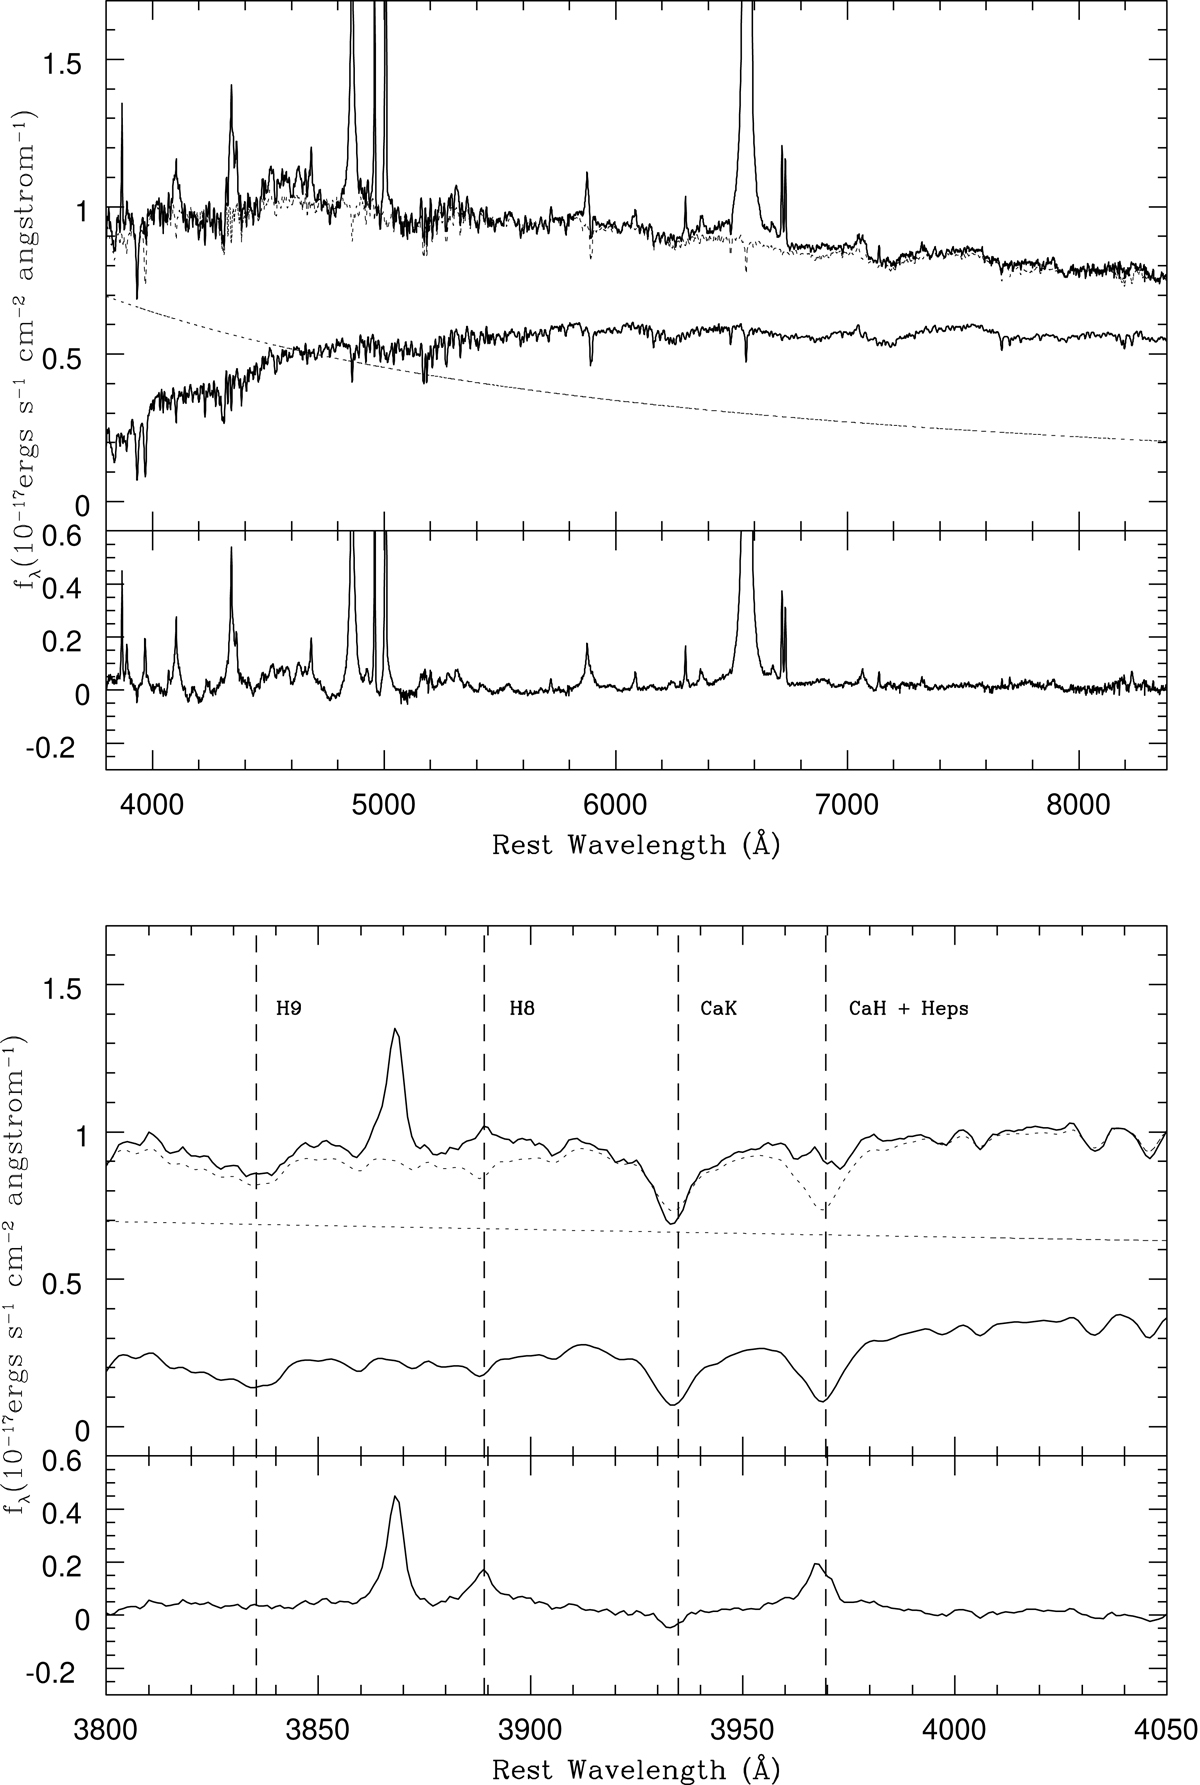
Top panel: stacked spectra with geometric mean, bottom panel: arithmetic mean. As in Fig. 2, we plot the observed spectrum (thick solid line), the modelled spectrum (dotted line), the host galaxy spectrum (thin solid line), the power-law contribution (dotted line), and the residual spectra (lower panel). The observed spectra is normalised at the flux value in λ = 4020. Bottom panel: same as top panel, but is zoomed in on the blue part of the spectra.
Current usage metrics show cumulative count of Article Views (full-text article views including HTML views, PDF and ePub downloads, according to the available data) and Abstracts Views on Vision4Press platform.
Data correspond to usage on the plateform after 2015. The current usage metrics is available 48-96 hours after online publication and is updated daily on week days.
Initial download of the metrics may take a while.