Free Access
Fig. 6.
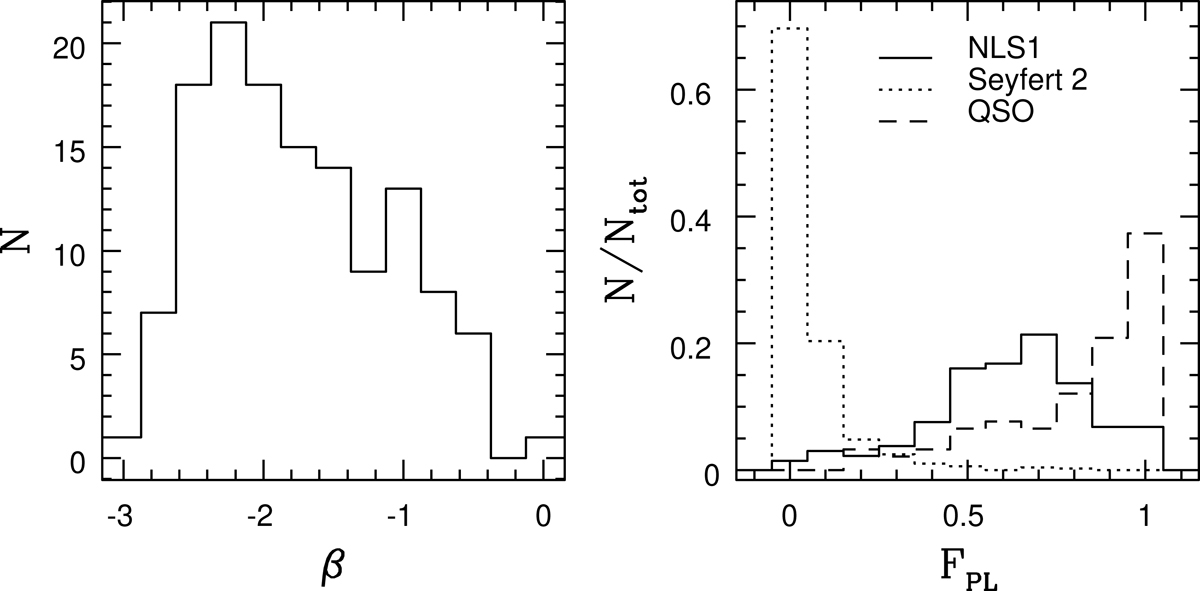
Distribution of power-law indexes obtained from STARLIGHT for our sample of 131 NLS1 (left panel) and fraction of contribution of this component to the total spectra (right panel). Solid line represents NLS1, dotted line BLAGNs, and dashed line Seyfert 2 galaxies.
Current usage metrics show cumulative count of Article Views (full-text article views including HTML views, PDF and ePub downloads, according to the available data) and Abstracts Views on Vision4Press platform.
Data correspond to usage on the plateform after 2015. The current usage metrics is available 48-96 hours after online publication and is updated daily on week days.
Initial download of the metrics may take a while.