Fig. 5.
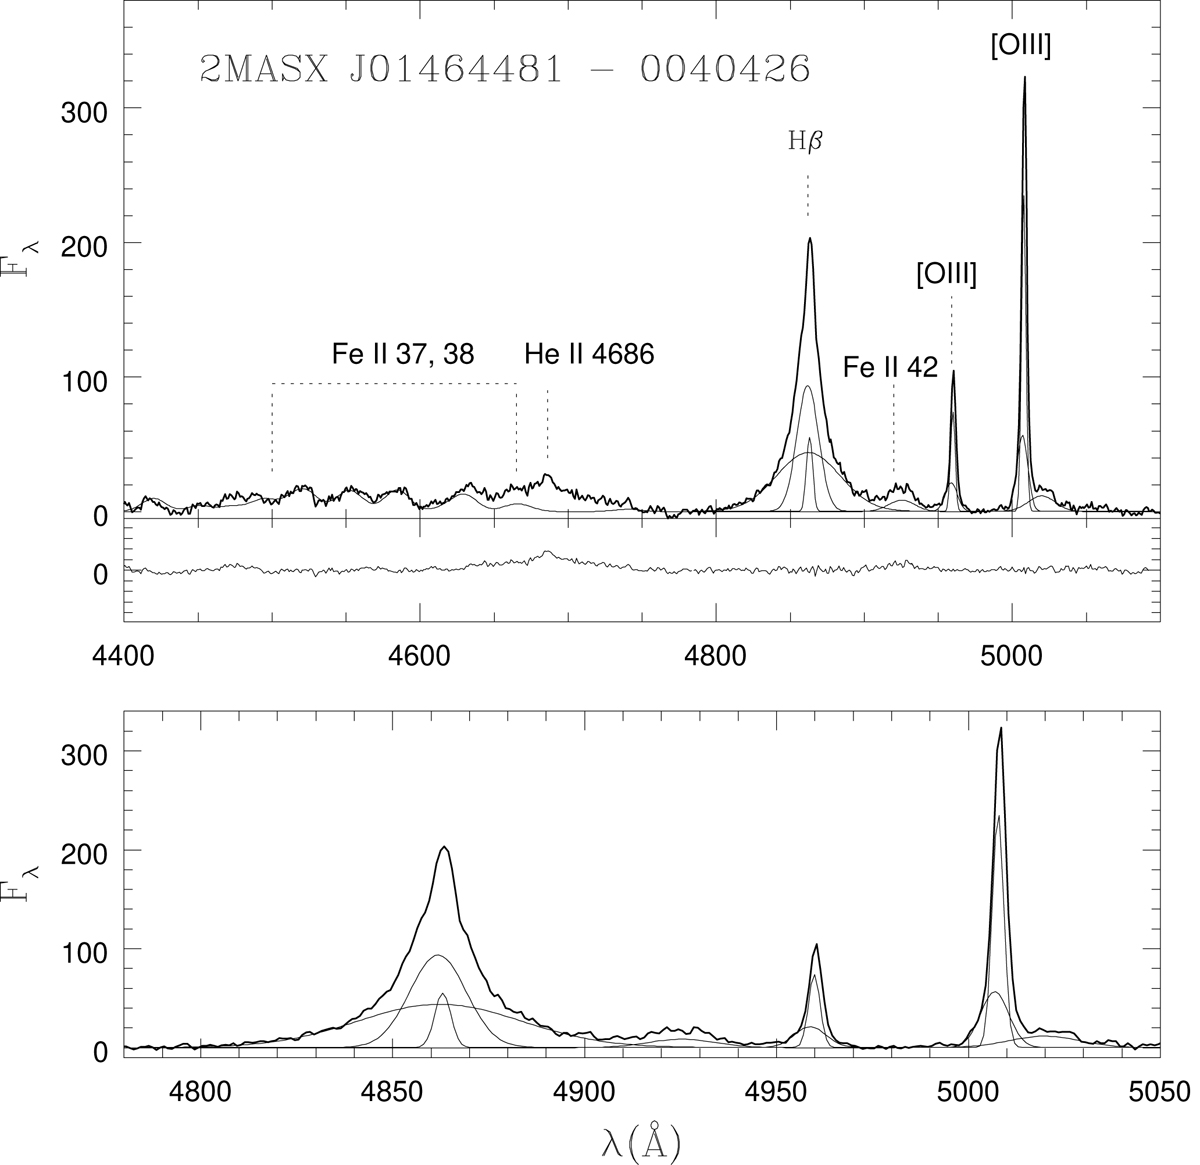
Top panel: Gaussian decomposition and iron fit for galaxy 2MASX J01464481−0040426. The observed spectrum flux is in arbitrary units (thick line); FeII template and Gaussian components obtained with LINER are in thin lines. The residual spectra are plotted on the lower sub-panel for clarity. Bottom panel: zoomed in view of the Hβ + [OIII] observed spectrum and its fit.
Current usage metrics show cumulative count of Article Views (full-text article views including HTML views, PDF and ePub downloads, according to the available data) and Abstracts Views on Vision4Press platform.
Data correspond to usage on the plateform after 2015. The current usage metrics is available 48-96 hours after online publication and is updated daily on week days.
Initial download of the metrics may take a while.