Fig. 8.
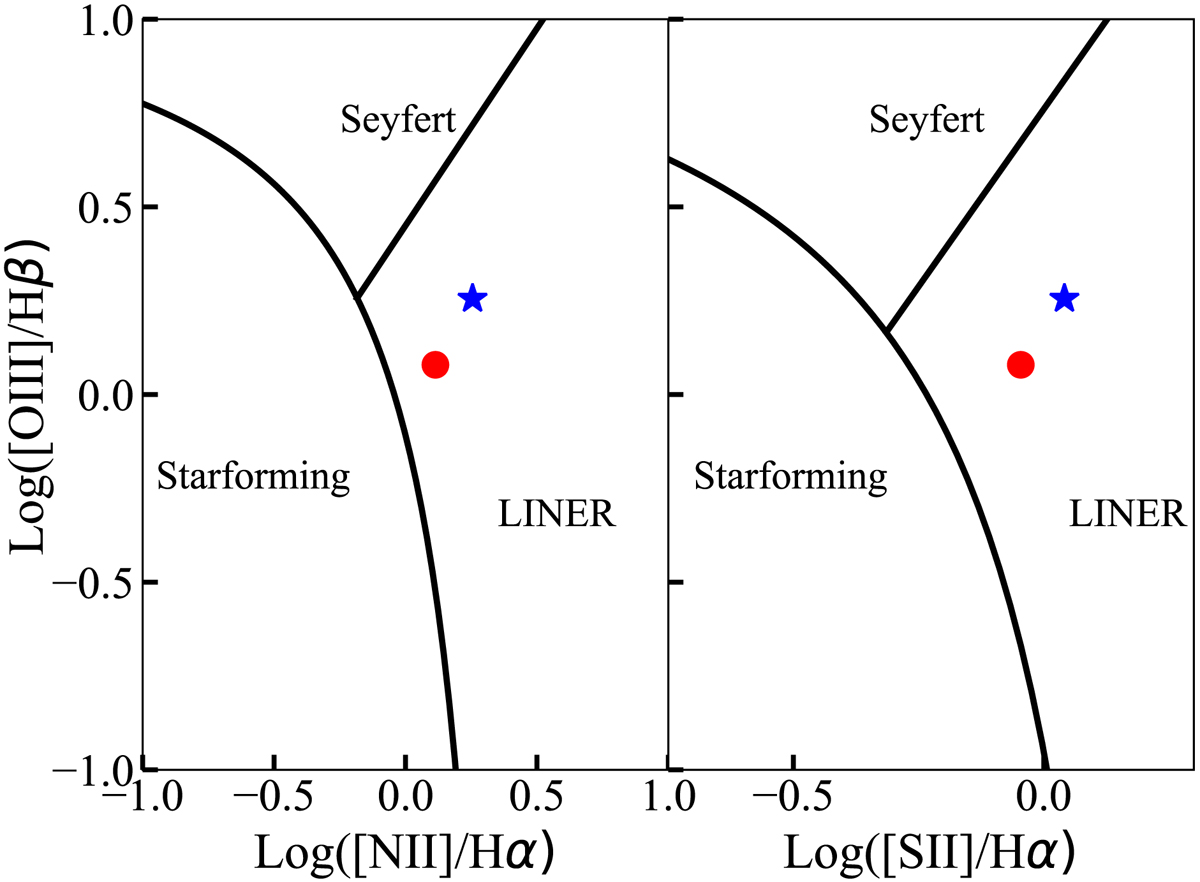
BPT diagrams showing the line ratios (Emonts 2006) of the off-nuclear regions of B2 0258+35. The blue stars represent the line ratios from the spectrum extracted from the south-western region, offset by ∼1.4 kpc from the nucleus, with PA = 64°. The red dots represent the line ratios from the spectrum extracted at a similar distance off the nucleus in the north-eastern region. The points clearly lie in the LINER portion of the diagram, suggesting the presence of shocks.
Current usage metrics show cumulative count of Article Views (full-text article views including HTML views, PDF and ePub downloads, according to the available data) and Abstracts Views on Vision4Press platform.
Data correspond to usage on the plateform after 2015. The current usage metrics is available 48-96 hours after online publication and is updated daily on week days.
Initial download of the metrics may take a while.