Fig. 7.
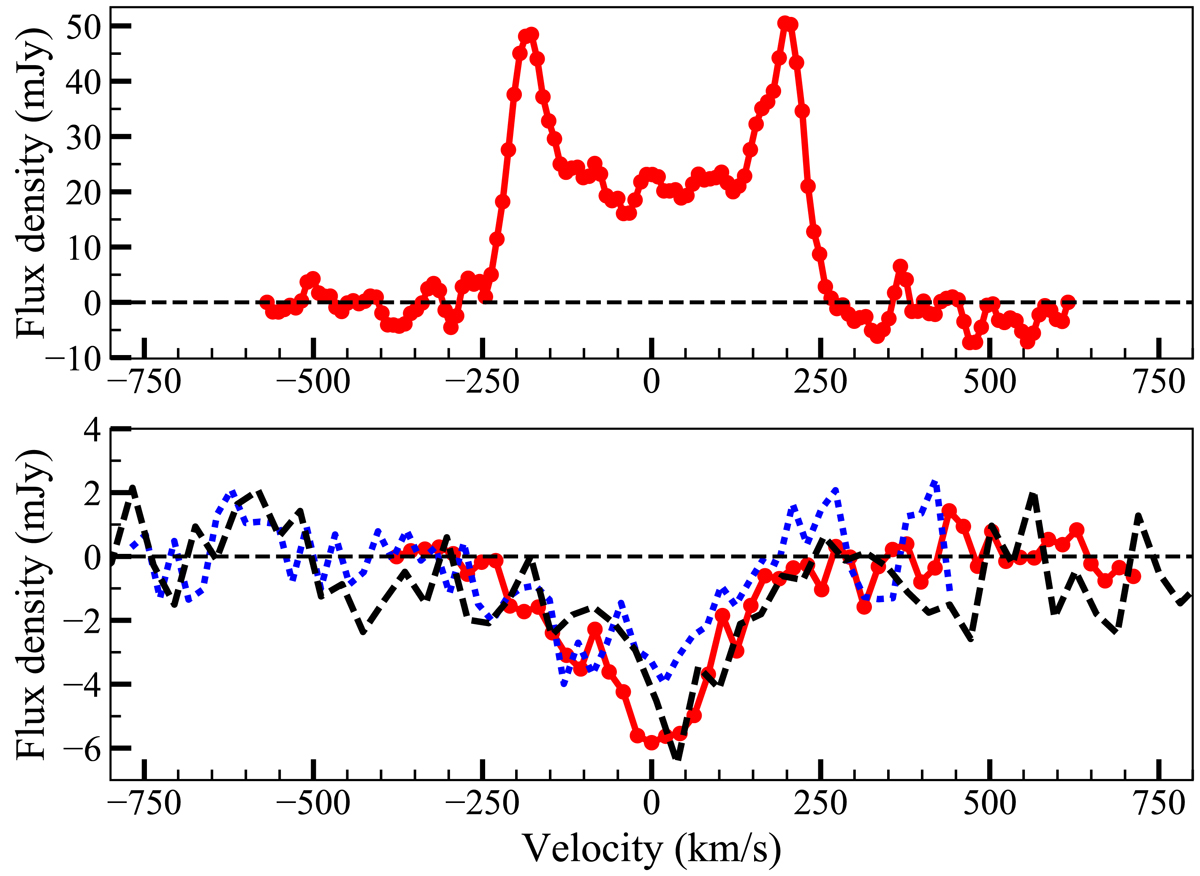
Comparison between the H I emission profile (top panel, red: Struve et al. 2010); CO emission profiles, inverted and in arbitrary units for ease of comparison (bottom panel, blue dotted: Prandoni et al. 2007; black dashed: O’Sullivan et al. 2015); and the WSRT H I absorption profile (bottom panel, red). The CO emission profile does not match the H I emission profile, implying that the CO emission does not arise from the molecular counterpart of the large H I disc. The H I absorption and the CO emission profiles match, implying that CO and absorbing H I are spatially coincident.
Current usage metrics show cumulative count of Article Views (full-text article views including HTML views, PDF and ePub downloads, according to the available data) and Abstracts Views on Vision4Press platform.
Data correspond to usage on the plateform after 2015. The current usage metrics is available 48-96 hours after online publication and is updated daily on week days.
Initial download of the metrics may take a while.