Fig. 3.
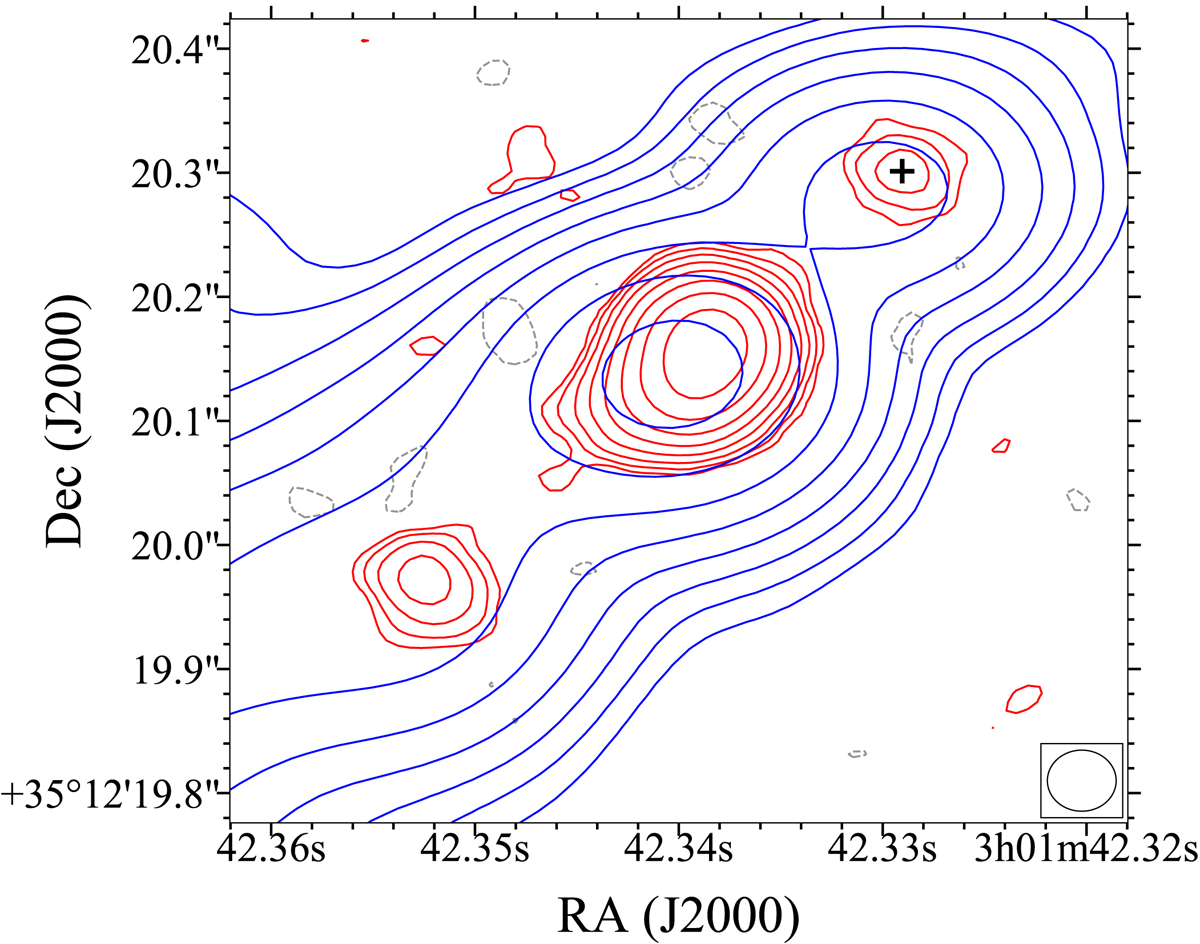
VLBI map of B2 0258+35 (beam size: 0.04923″ × 0.04136″; red contours). The contours start at 400 μJy beam−1 (4σ) and increase by a factor of two at each step. The 4σ negative contours are shown in grey and the beam is shown in the bottom right corner of the map. The black cross marks the VLBI core. The 22 GHz VLA image from Giroletti et al. (2005) is overlaid in blue contours for reference, as in Fig. 2. Only 10% of the total VLA flux is recovered.
Current usage metrics show cumulative count of Article Views (full-text article views including HTML views, PDF and ePub downloads, according to the available data) and Abstracts Views on Vision4Press platform.
Data correspond to usage on the plateform after 2015. The current usage metrics is available 48-96 hours after online publication and is updated daily on week days.
Initial download of the metrics may take a while.