Fig. 2.
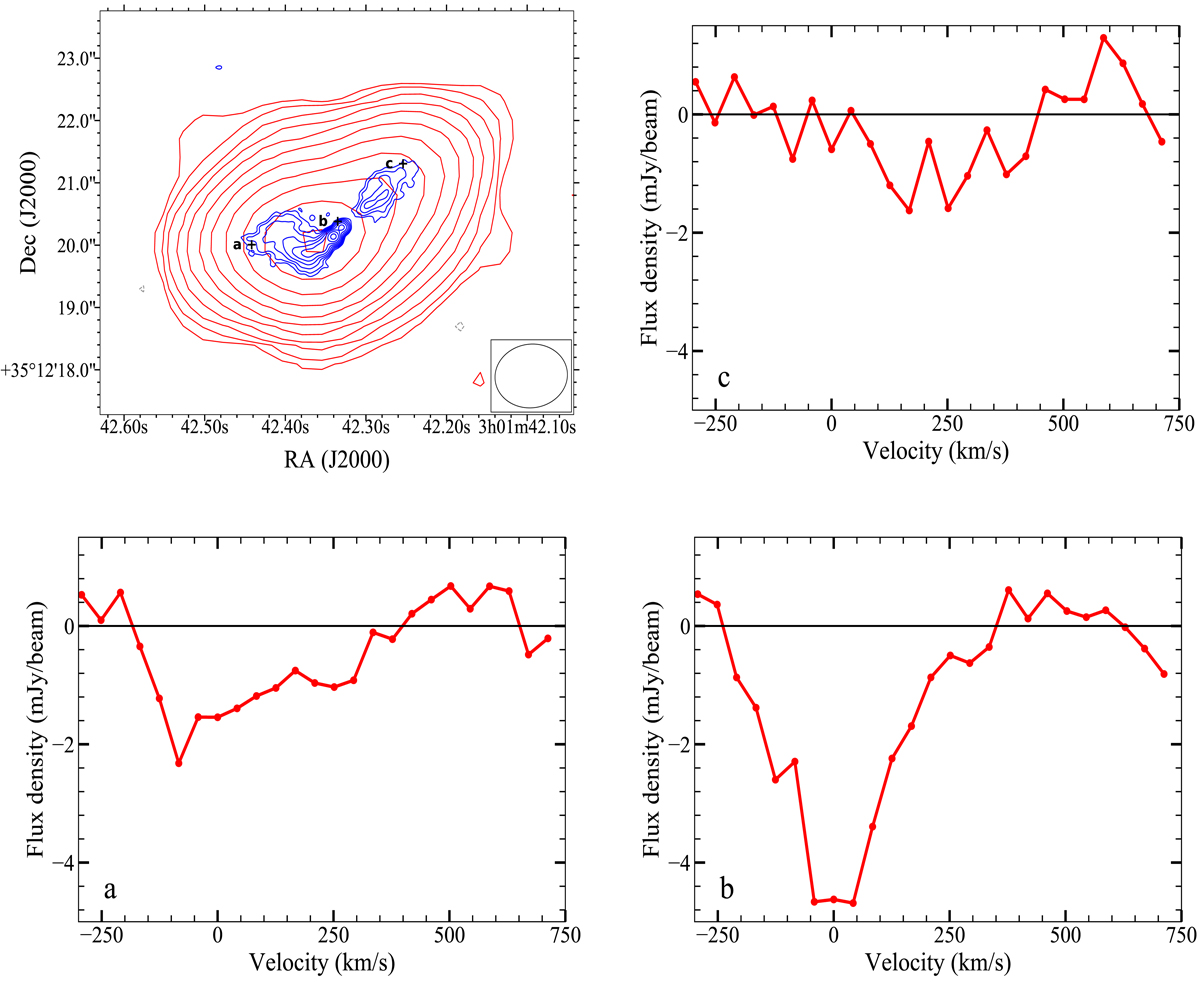
Top left: VLA continuum map of B2 0258+35 (beam size: 1.13″ × 0.98″; red contours). The contour levels start from 1 mJy beam−1 (3σ) and increase by a factor of two. The 3σ negative contours are shown in grey and the beam is shown in the bottom right corner of the image. The regions from which the H I absorption spectra are extracted are labelled. The 22 GHz VLA map (by Giroletti et al. 2005, beam size: 0.12″ × 0.12″) is overlaid in blue contours to show the underlying continuum structure. These contours start from 325 μJy beam−1 (5σ) and increase by a factor of two. Bottom left, bottom right, and top right: absorption spectra extracted from the regions that are marked are in black in the continuum map. The spectra have been Hanning-smoothed and resampled to a velocity resolution of ∼42 km s−1.
Current usage metrics show cumulative count of Article Views (full-text article views including HTML views, PDF and ePub downloads, according to the available data) and Abstracts Views on Vision4Press platform.
Data correspond to usage on the plateform after 2015. The current usage metrics is available 48-96 hours after online publication and is updated daily on week days.
Initial download of the metrics may take a while.