Fig. 6.
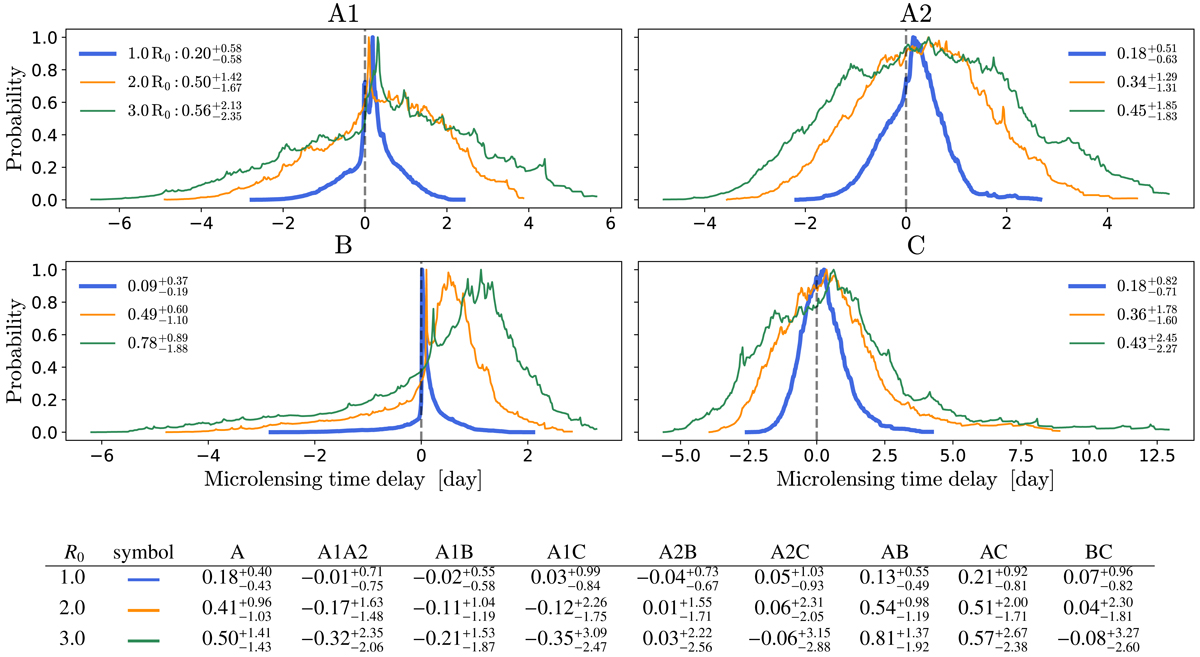
Distributions of the excess of microlensing time delay for the four lensed image of WFI2033−4723. The values displayed represent the 16th, 50th and 84th percentiles of the plotted distributions. The thicker lines (in blue) indicate the fiducial case where the source size corresponds to the thin-disk model prediction. The vertical dashed grey lines represent the case where no microlensing time-delay is present. The table below the figure reports the percentiles of the distributions of the combined image A as well as the lensed image pair.
Current usage metrics show cumulative count of Article Views (full-text article views including HTML views, PDF and ePub downloads, according to the available data) and Abstracts Views on Vision4Press platform.
Data correspond to usage on the plateform after 2015. The current usage metrics is available 48-96 hours after online publication and is updated daily on week days.
Initial download of the metrics may take a while.