Fig. 5.
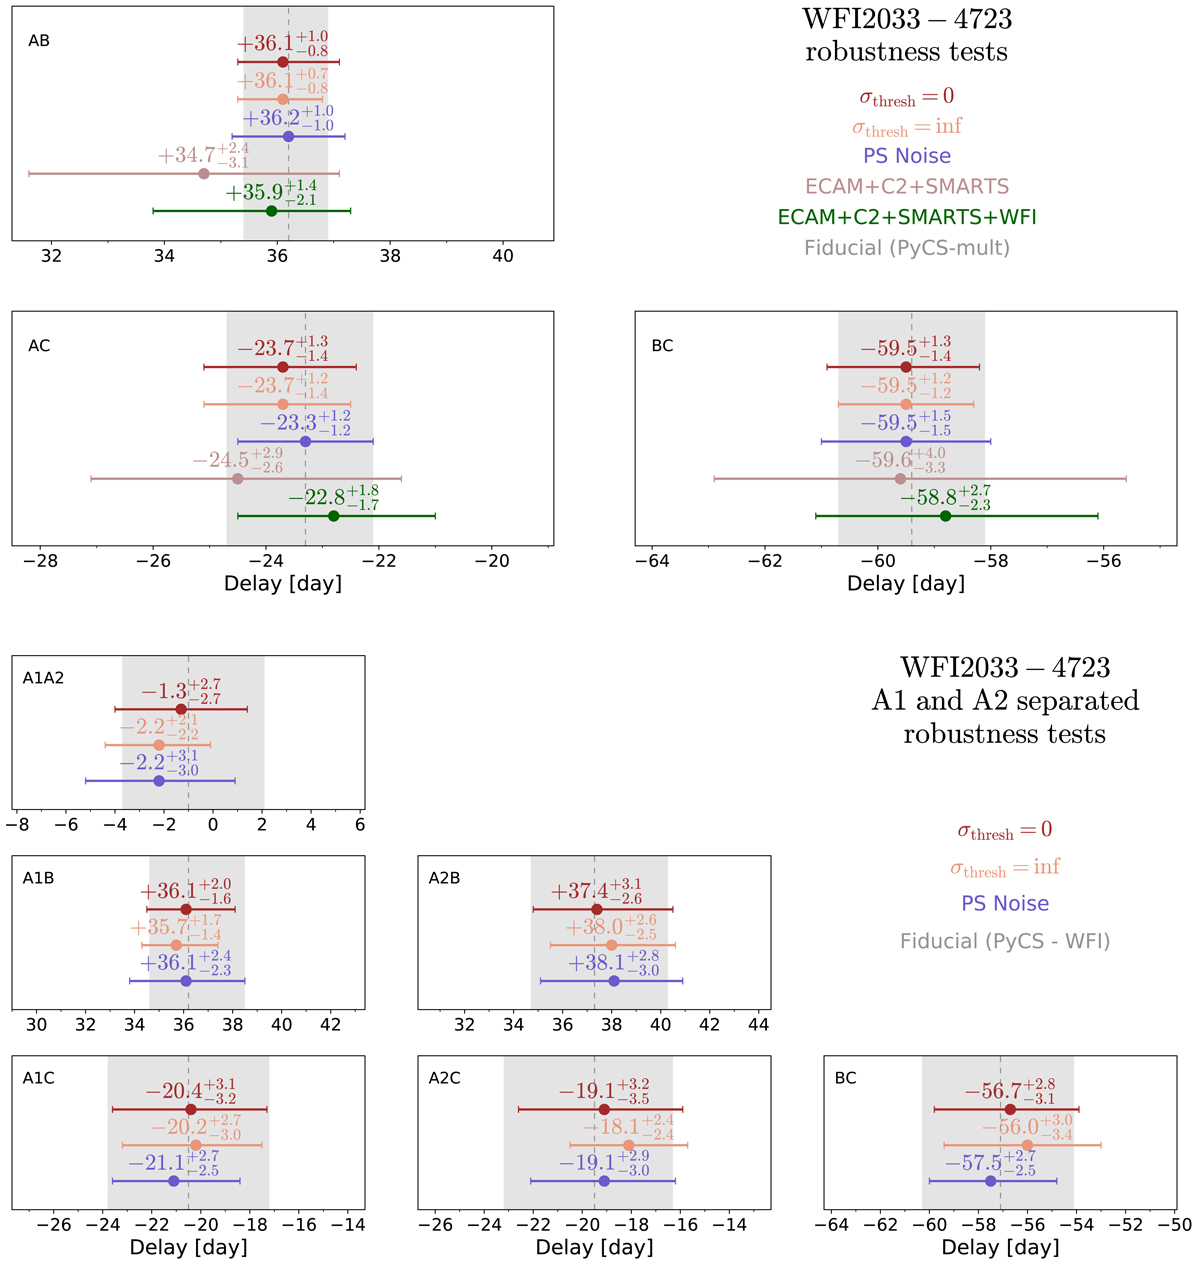
Results of the robustness tests for WFI2033−4723 time-delay measurements presented in Sect. 3.4. The shaded vertical bands correspond to our fiducial results, labelled “PyCS-mult” and “PyCS – WFI” in Figs. 3 and 4 for the top and bottom groups of panels, respectively. The values indicated above each measurement represent the 50th, 10th and 840th percentiles of the respective probability distributions.
Current usage metrics show cumulative count of Article Views (full-text article views including HTML views, PDF and ePub downloads, according to the available data) and Abstracts Views on Vision4Press platform.
Data correspond to usage on the plateform after 2015. The current usage metrics is available 48-96 hours after online publication and is updated daily on week days.
Initial download of the metrics may take a while.