Fig. 4.
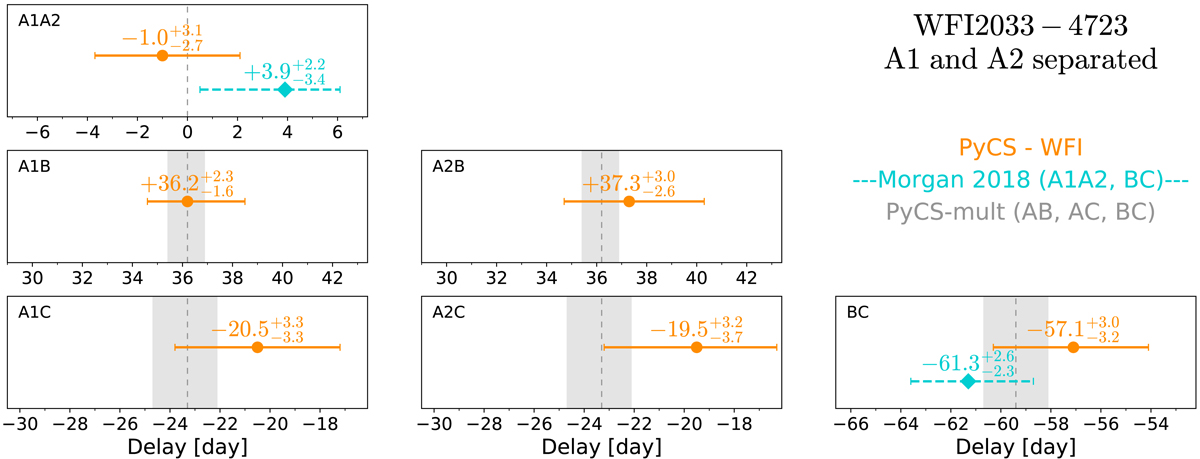
WFI2033−4723 time-delay estimates using the WFI data set with the A1 and A2 light curves separated. The A1A2 and BC measurements from Morgan et al. (2018) are reported for comparison. We also report the “PyCS-mult” estimates from Fig. 3, obtained using the virtual A light curve, represented in this figure as shaded vertical bands. In this latter case, we report the AB and AC time-delay estimates in the A1B/A2B and A1C/A2C panels, respectively. We note that the BC estimate from WFI presented here slightly differs from Fig. 3 since the free-knot spline estimates used in the combined group are obtained by a joint fit to all of the light curves, and so are sensitive to the use of A1 and A2 instead of A. The values above each measurement give the 50th, 16th and 84th percentiles of the respective probability distributions.
Current usage metrics show cumulative count of Article Views (full-text article views including HTML views, PDF and ePub downloads, according to the available data) and Abstracts Views on Vision4Press platform.
Data correspond to usage on the plateform after 2015. The current usage metrics is available 48-96 hours after online publication and is updated daily on week days.
Initial download of the metrics may take a while.