Fig. 3.
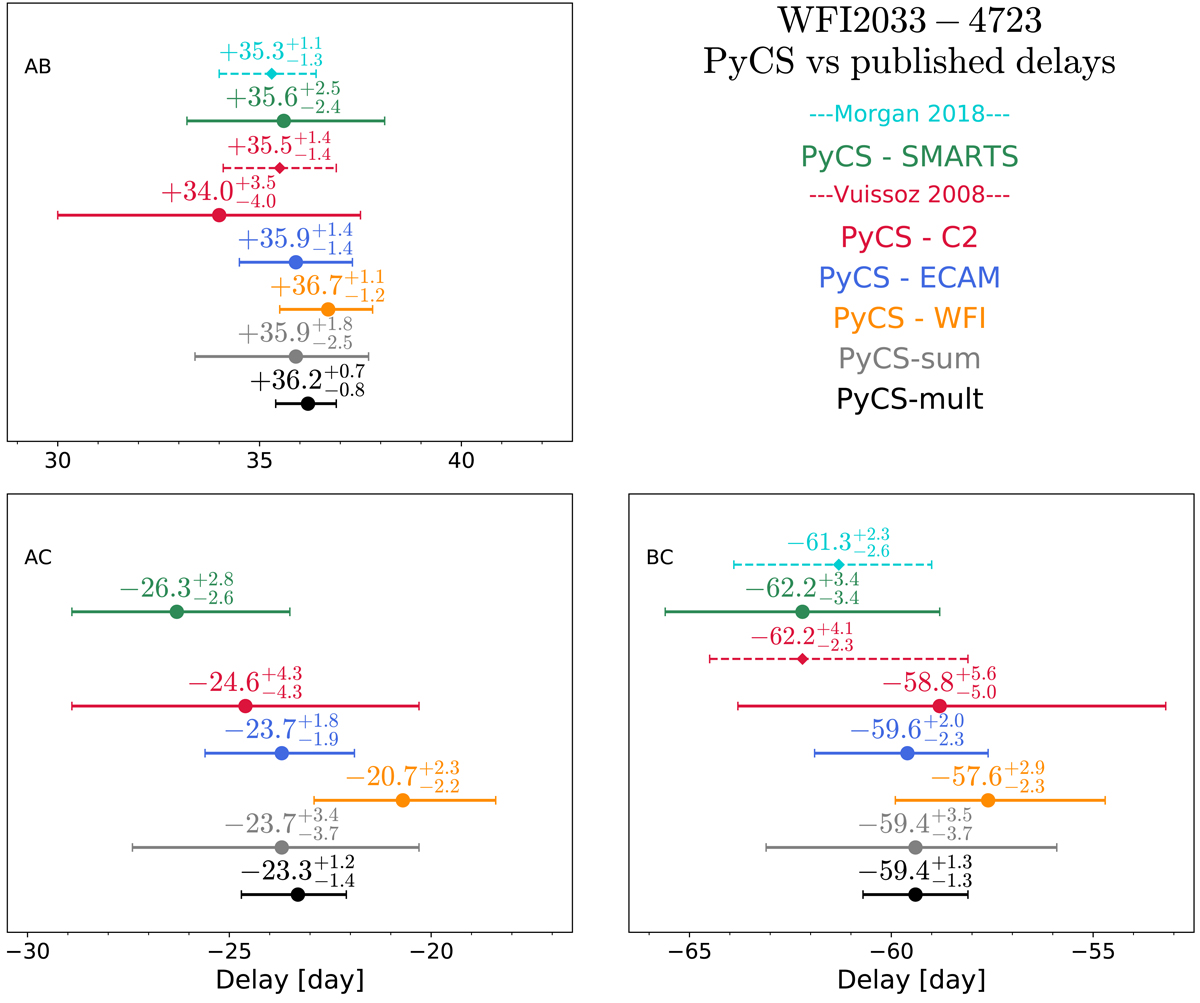
WFI2033−4723 time-delay estimates. The colored points labelled “PyCS” represent the final time-delay estimates for each data set, obtained after combining the curve-shifting technique parameters following the marginalisation scheme presented in Sect. 3.1. The gray and black points, respectively labelled “PyCS-sum” and “PyCS-mult” represent the marginalisation and combination of the results obtained from the individual data sets. Indicated with small diamonds and dashed lines are the AB and BC delays taken from Morgan et al. (2018) and Vuissoz et al. (2008), respectively. The similar color between “PyCS -C2” and Vuissoz 2008 indicates that both measurement share the same data set, although less complete in the latter case (see Table 1). The values indicated above each measurement represent the 50th, 16th and 84th percentiles of the respective probability distributions.
Current usage metrics show cumulative count of Article Views (full-text article views including HTML views, PDF and ePub downloads, according to the available data) and Abstracts Views on Vision4Press platform.
Data correspond to usage on the plateform after 2015. The current usage metrics is available 48-96 hours after online publication and is updated daily on week days.
Initial download of the metrics may take a while.