Fig. 2.
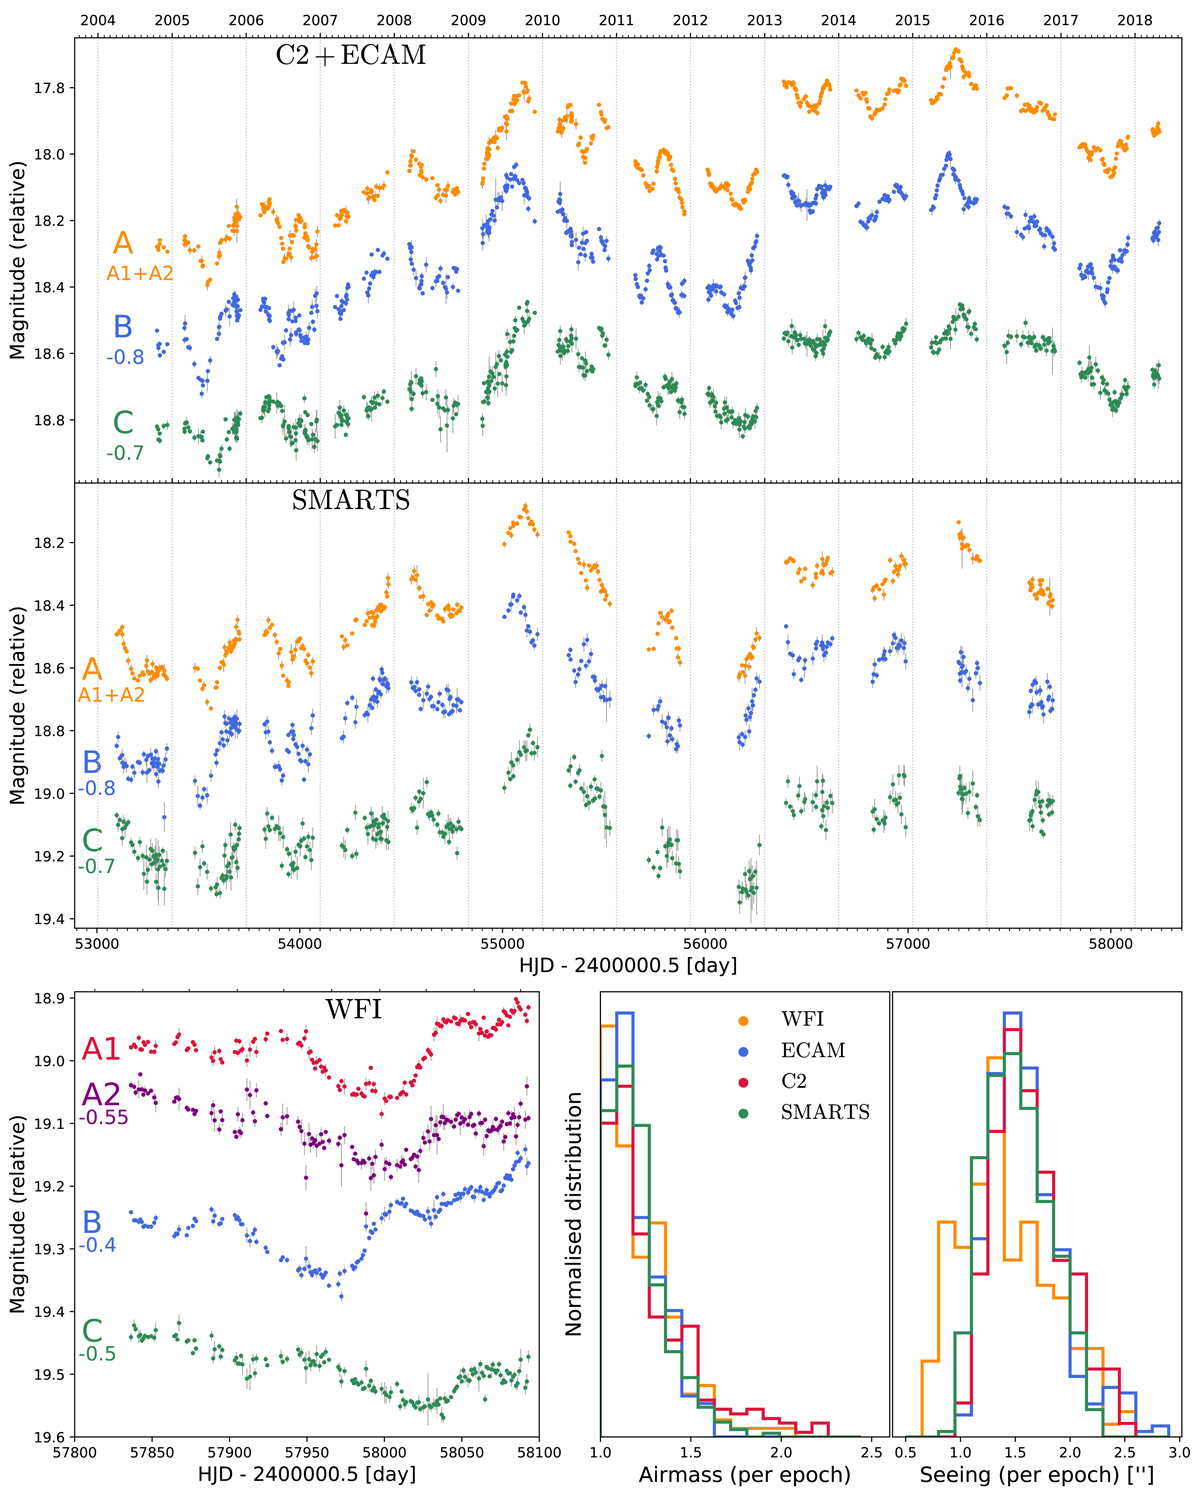
WFI2033−4723 light curves from the four different instruments used in this work. Top panel: Euler data sets (C2+ECAM instruments), with the change occuring in October 2010, corresponding to the small gap visible in the 2010 season. Middle panel: SMARTS data set. Bottom left panel: WFI data set, where the A1 and A2 images were individually resolved thanks to superior image quality and longer exposure times. We note that different calibration stars were used for the different data sets, hence the differences in the relative magnitudes between the instruments. Bottom right panel: normalised distribution of the airmass and seeing of all the individual exposures in each data set.
Current usage metrics show cumulative count of Article Views (full-text article views including HTML views, PDF and ePub downloads, according to the available data) and Abstracts Views on Vision4Press platform.
Data correspond to usage on the plateform after 2015. The current usage metrics is available 48-96 hours after online publication and is updated daily on week days.
Initial download of the metrics may take a while.