Fig. 2.
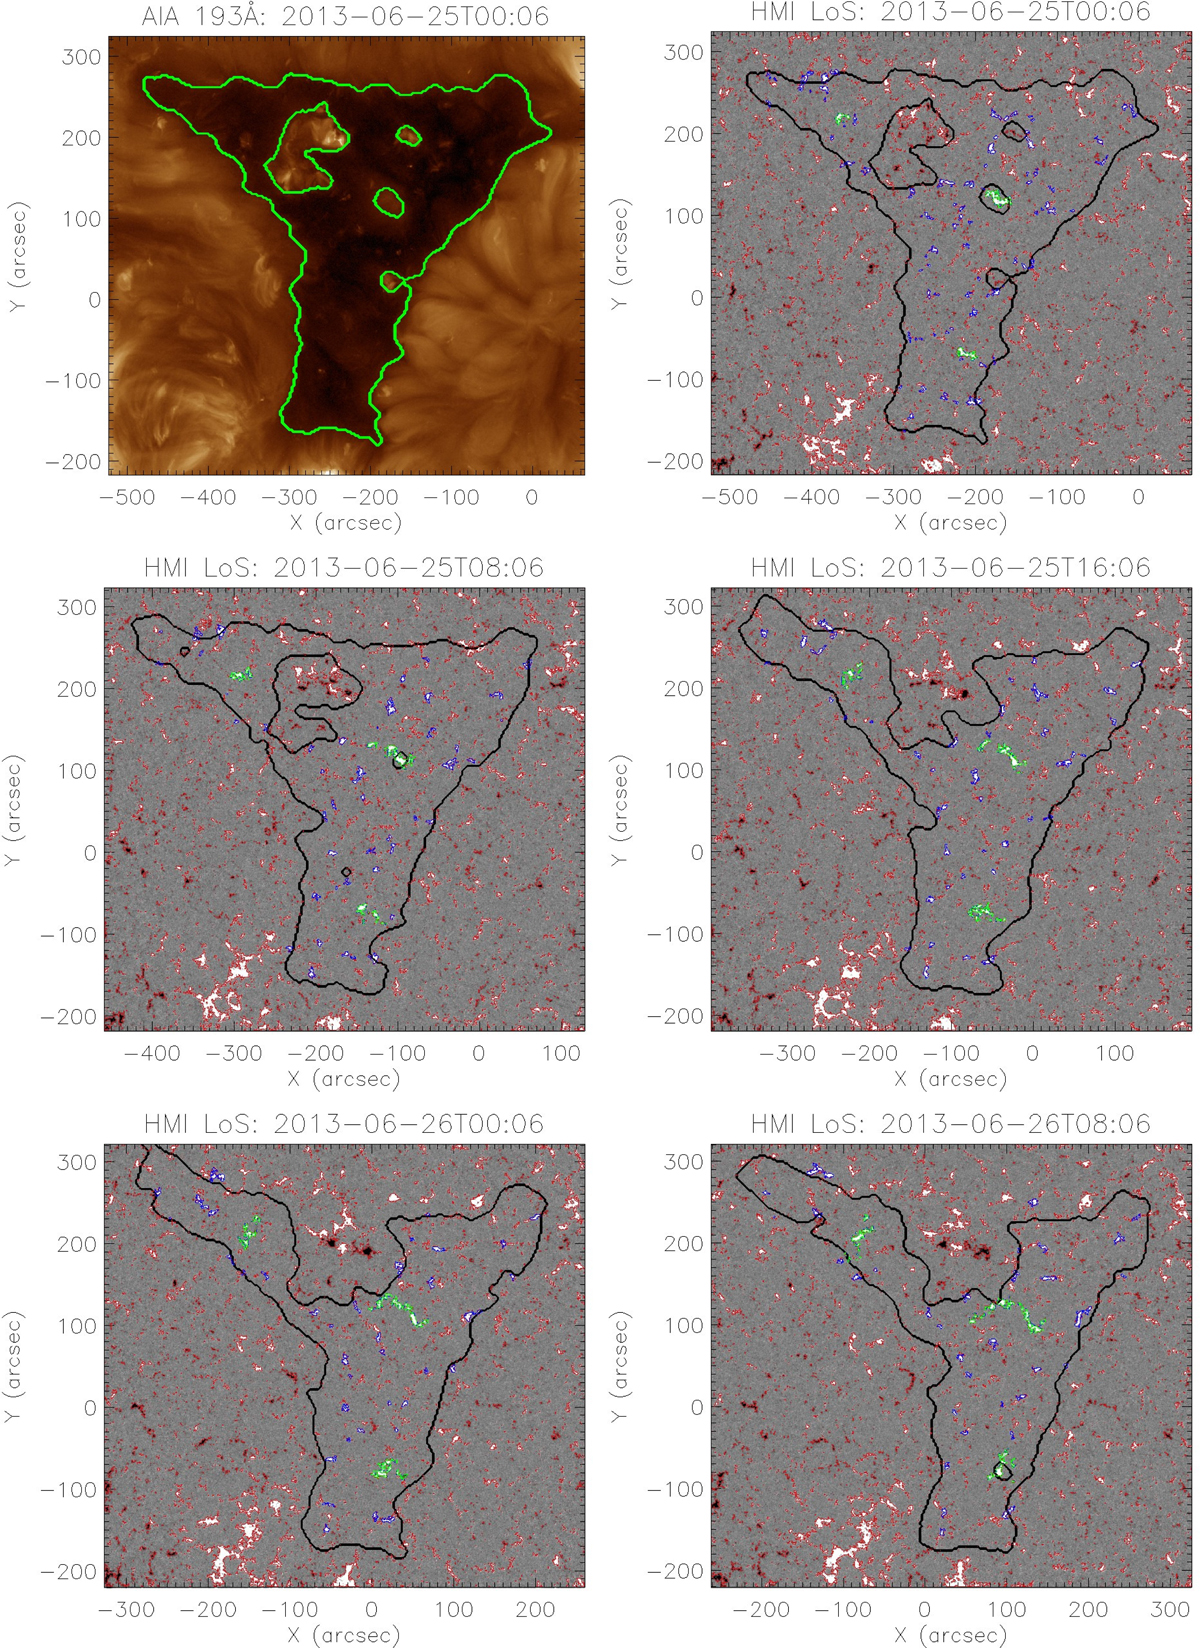
SDO/AIA 193 Å filtergram and HMI-LoS magnetograms, showing snapshots of the evolution of the photospheric magnetic field below the coronal hole on July 25 and 26, 2013. The magnetogram is scaled to ±100 G and the magnetic elements are outlined in red, blue, and green (see text). The evolution of the magnetic elements is shown in an online movie.
Current usage metrics show cumulative count of Article Views (full-text article views including HTML views, PDF and ePub downloads, according to the available data) and Abstracts Views on Vision4Press platform.
Data correspond to usage on the plateform after 2015. The current usage metrics is available 48-96 hours after online publication and is updated daily on week days.
Initial download of the metrics may take a while.