Fig. 13.
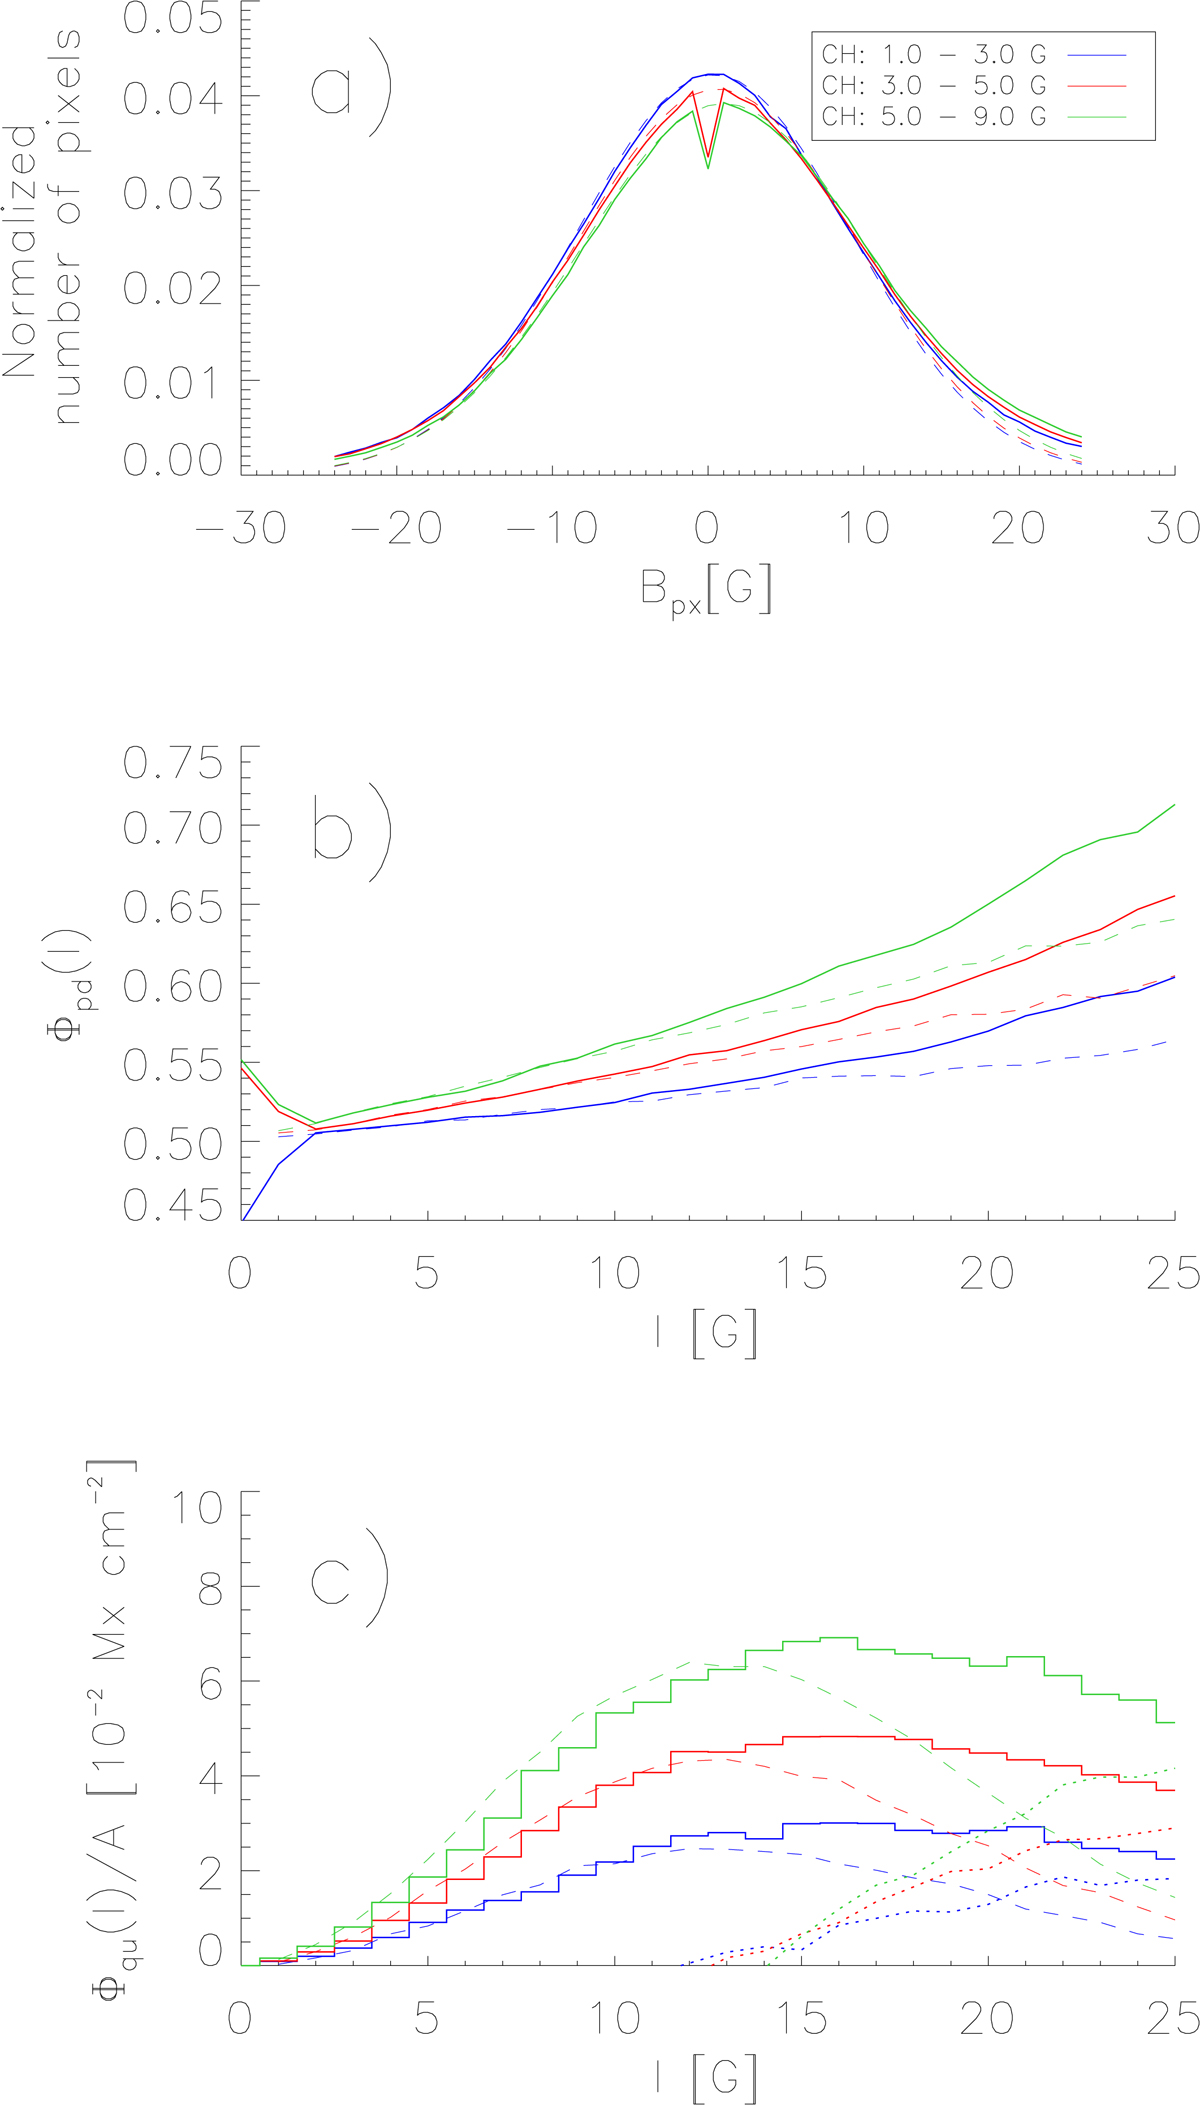
Average distribution of the magnetic field densities in coronal holes (a). Imbalance of the magnetic field at a given magnetic level l (b), and total unbalanced magnetic flux arising from pixels at a magnetic level l (c). The solid lines are the measured distributions and the dashed lines correspond to the fitted background magnetic field. In panel c, the dotted lines give the remaining unbalanced magnetic flux of the quiet coronal hole regions, which is not explained by a background magnetic field.
Current usage metrics show cumulative count of Article Views (full-text article views including HTML views, PDF and ePub downloads, according to the available data) and Abstracts Views on Vision4Press platform.
Data correspond to usage on the plateform after 2015. The current usage metrics is available 48-96 hours after online publication and is updated daily on week days.
Initial download of the metrics may take a while.