This article has 2 errata:
[https://doi.org/10.1051/0004-6361/201935428e]
[https://doi.org/10.1051/0004-6361/201935887e]
Fig. 4.
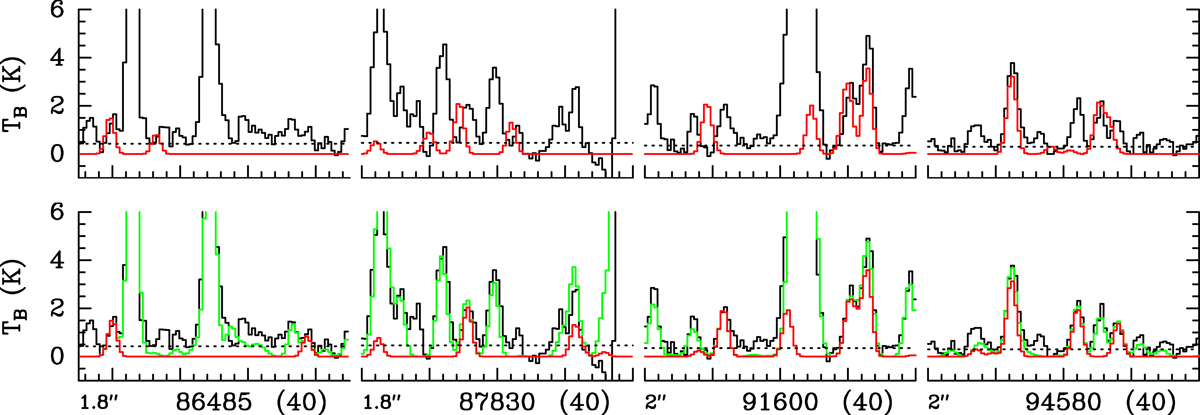
Examples of lines of acetone covered by EMoCA toward Sgr B2(N2). The ALMA spectrum is shown in black in all panels. The red spectrum shows the synthetic spectrum of acetone computed with the JPL entry (tag 58003, version 1) in the top row and with the new predictions presented in this work in the bottom row. The synthetic spectrum of all molecules identified so far, including acetone, is shown in green. The central frequency and width of the frequency range (in parentheses) are indicated at the bottom in MHz. The angular resolution (HPBW) is also indicated. The y-axis is labeled in brightness temperature units. The dotted line indicates the 3σ noise level. The new predictions match the observed spectrum much better.
Current usage metrics show cumulative count of Article Views (full-text article views including HTML views, PDF and ePub downloads, according to the available data) and Abstracts Views on Vision4Press platform.
Data correspond to usage on the plateform after 2015. The current usage metrics is available 48-96 hours after online publication and is updated daily on week days.
Initial download of the metrics may take a while.