This article has 2 errata:
[https://doi.org/10.1051/0004-6361/201935428e]
[https://doi.org/10.1051/0004-6361/201935887e]
Fig. 2.
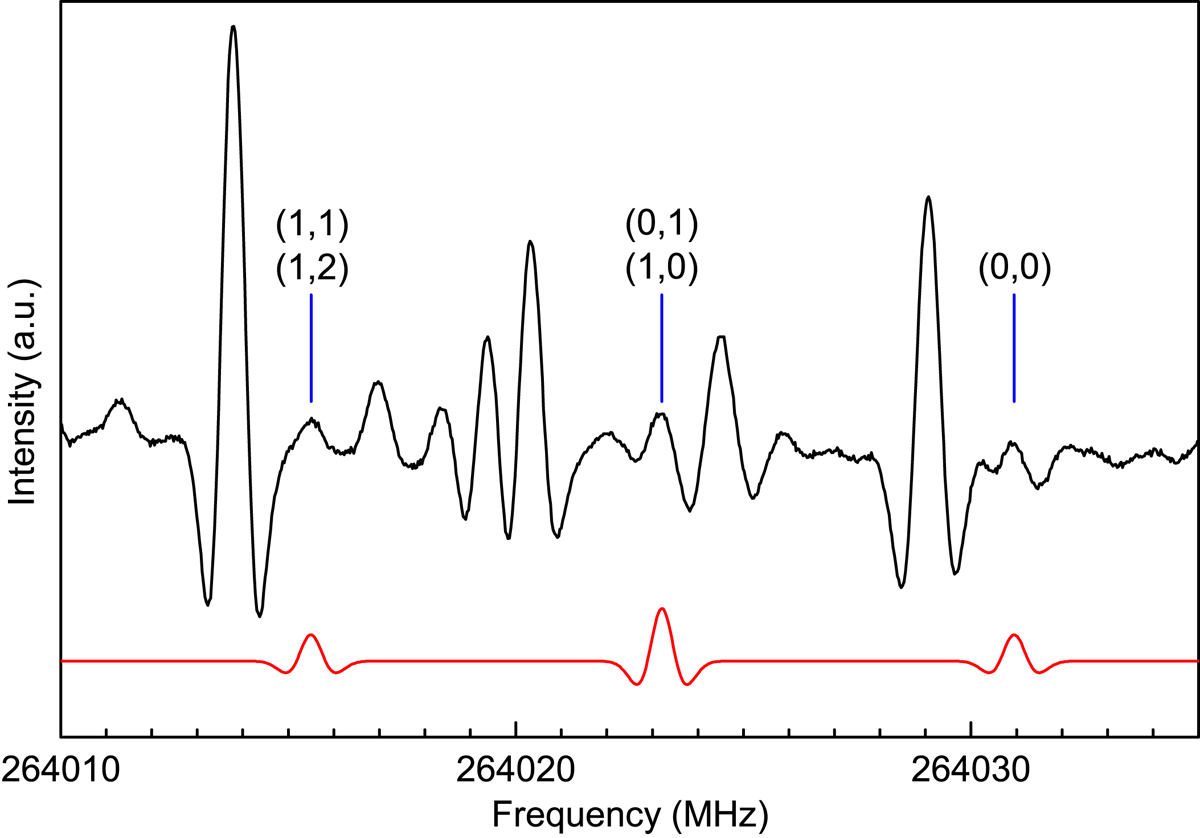
Section of the rotational spectrum of acetone in natural isotopic composition (in black) in the region of the oblate paired ![]() transition of 13CH3C(O)CH3 with
transition of 13CH3C(O)CH3 with ![]() and
and ![]() . The red trace shows the simulation from our final parameters in Table 4. The internal rotation pattern (1, 1)+(1, 2):(0, 1)+(1, 0):(1, 1) is particularly easy to identify because of its simple (1 + 1):(2 + 2):2 = 1 : 2 : 1 intensity ratio and the torsional substates are given in the ERHAM notation (in blue), see Table 2. No other line in the shown section can be assigned based on the data from our present study. Thus, the dense spectrum also demonstrates the challenge of assigning 13CH3C(O)CH3 lines in natural abundance.
. The red trace shows the simulation from our final parameters in Table 4. The internal rotation pattern (1, 1)+(1, 2):(0, 1)+(1, 0):(1, 1) is particularly easy to identify because of its simple (1 + 1):(2 + 2):2 = 1 : 2 : 1 intensity ratio and the torsional substates are given in the ERHAM notation (in blue), see Table 2. No other line in the shown section can be assigned based on the data from our present study. Thus, the dense spectrum also demonstrates the challenge of assigning 13CH3C(O)CH3 lines in natural abundance.
Current usage metrics show cumulative count of Article Views (full-text article views including HTML views, PDF and ePub downloads, according to the available data) and Abstracts Views on Vision4Press platform.
Data correspond to usage on the plateform after 2015. The current usage metrics is available 48-96 hours after online publication and is updated daily on week days.
Initial download of the metrics may take a while.