Free Access
This article has 2 errata:
[https://doi.org/10.1051/0004-6361/201935428e]
[https://doi.org/10.1051/0004-6361/201935887e]
Fig. 1.
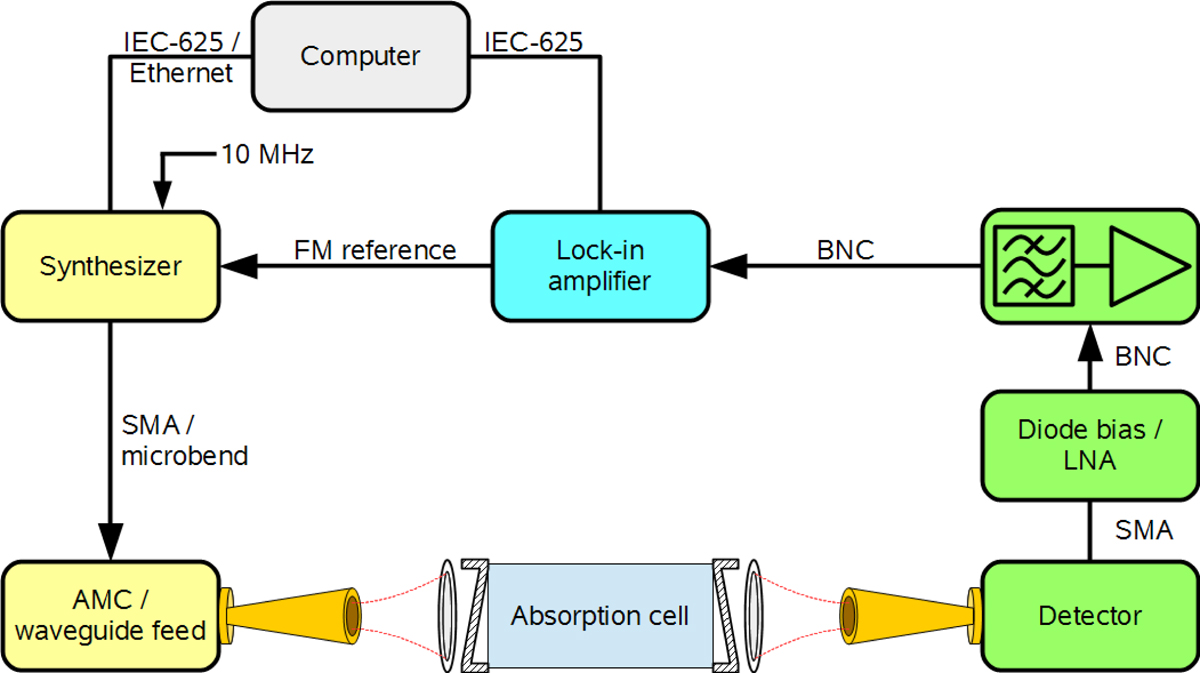
Schematic of the general experimental setup. A single-pass setup is shown for the sake of clarity, although several measurements were performed with a double-pass setup, where the frequency source and detector are located on the same side of the cell.
Current usage metrics show cumulative count of Article Views (full-text article views including HTML views, PDF and ePub downloads, according to the available data) and Abstracts Views on Vision4Press platform.
Data correspond to usage on the plateform after 2015. The current usage metrics is available 48-96 hours after online publication and is updated daily on week days.
Initial download of the metrics may take a while.